Resource Maps

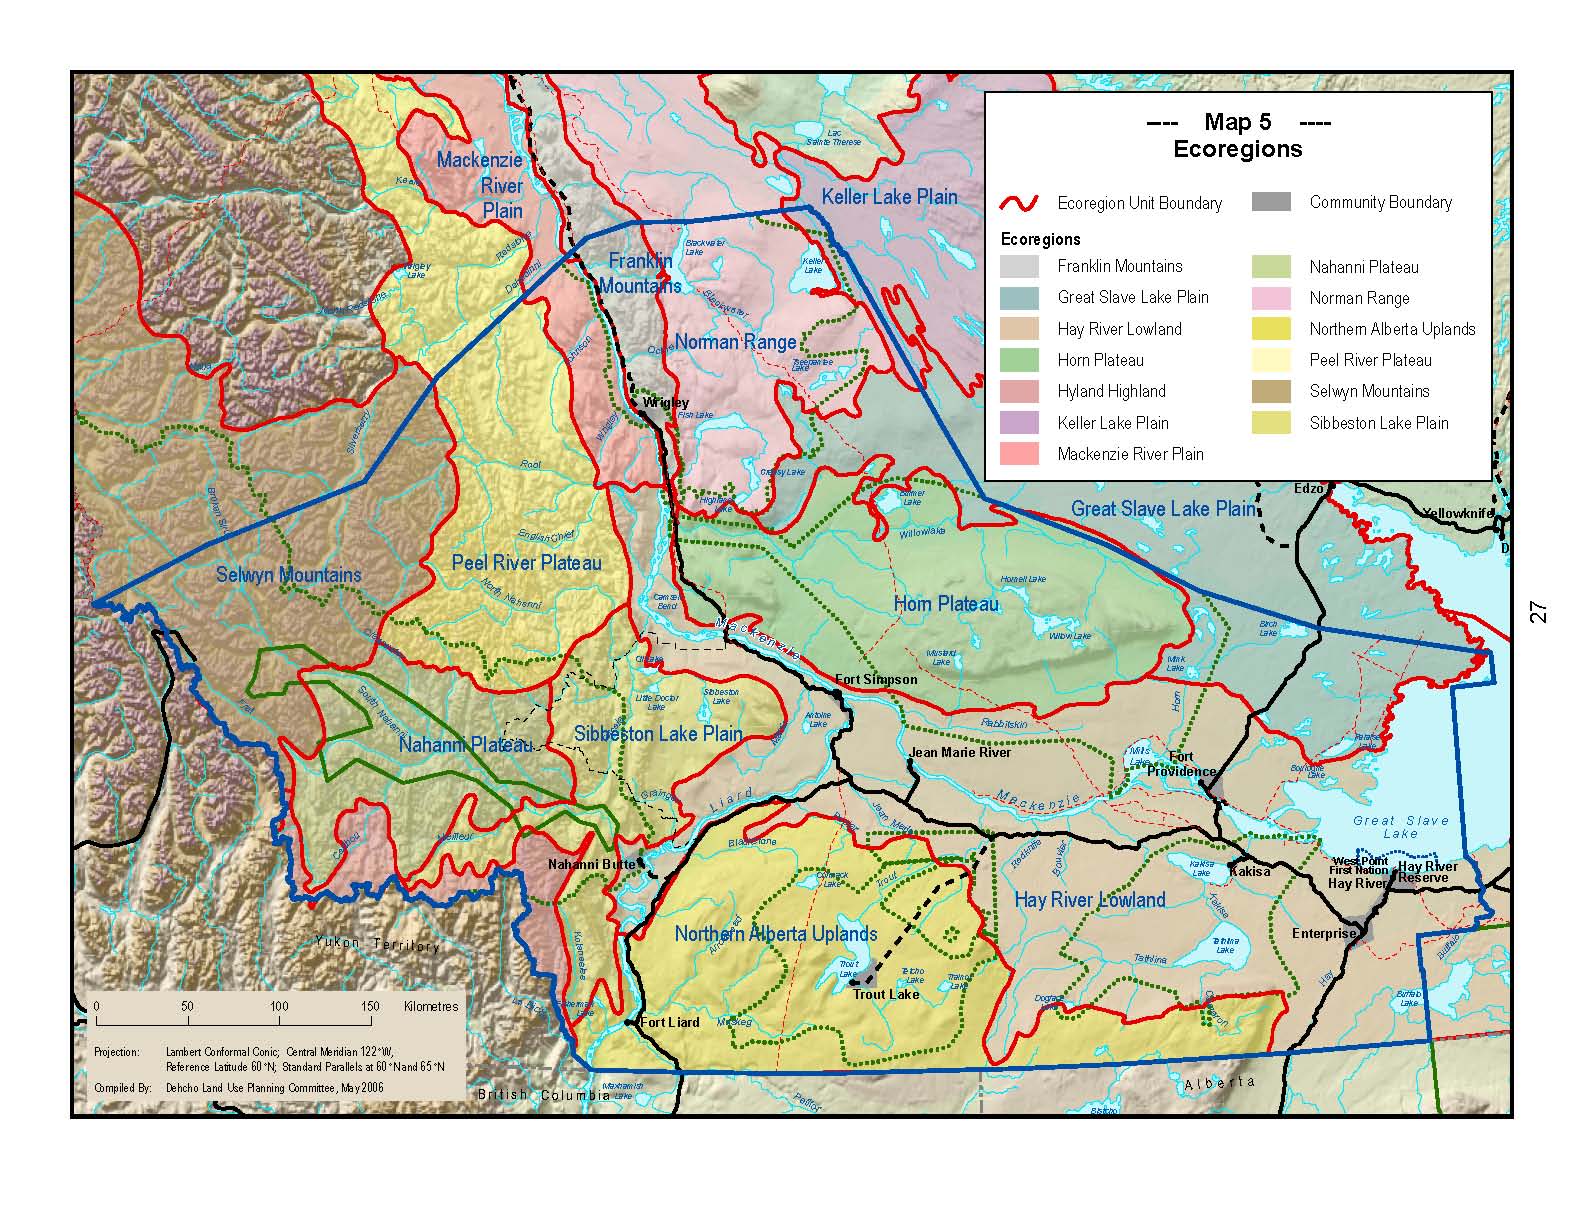
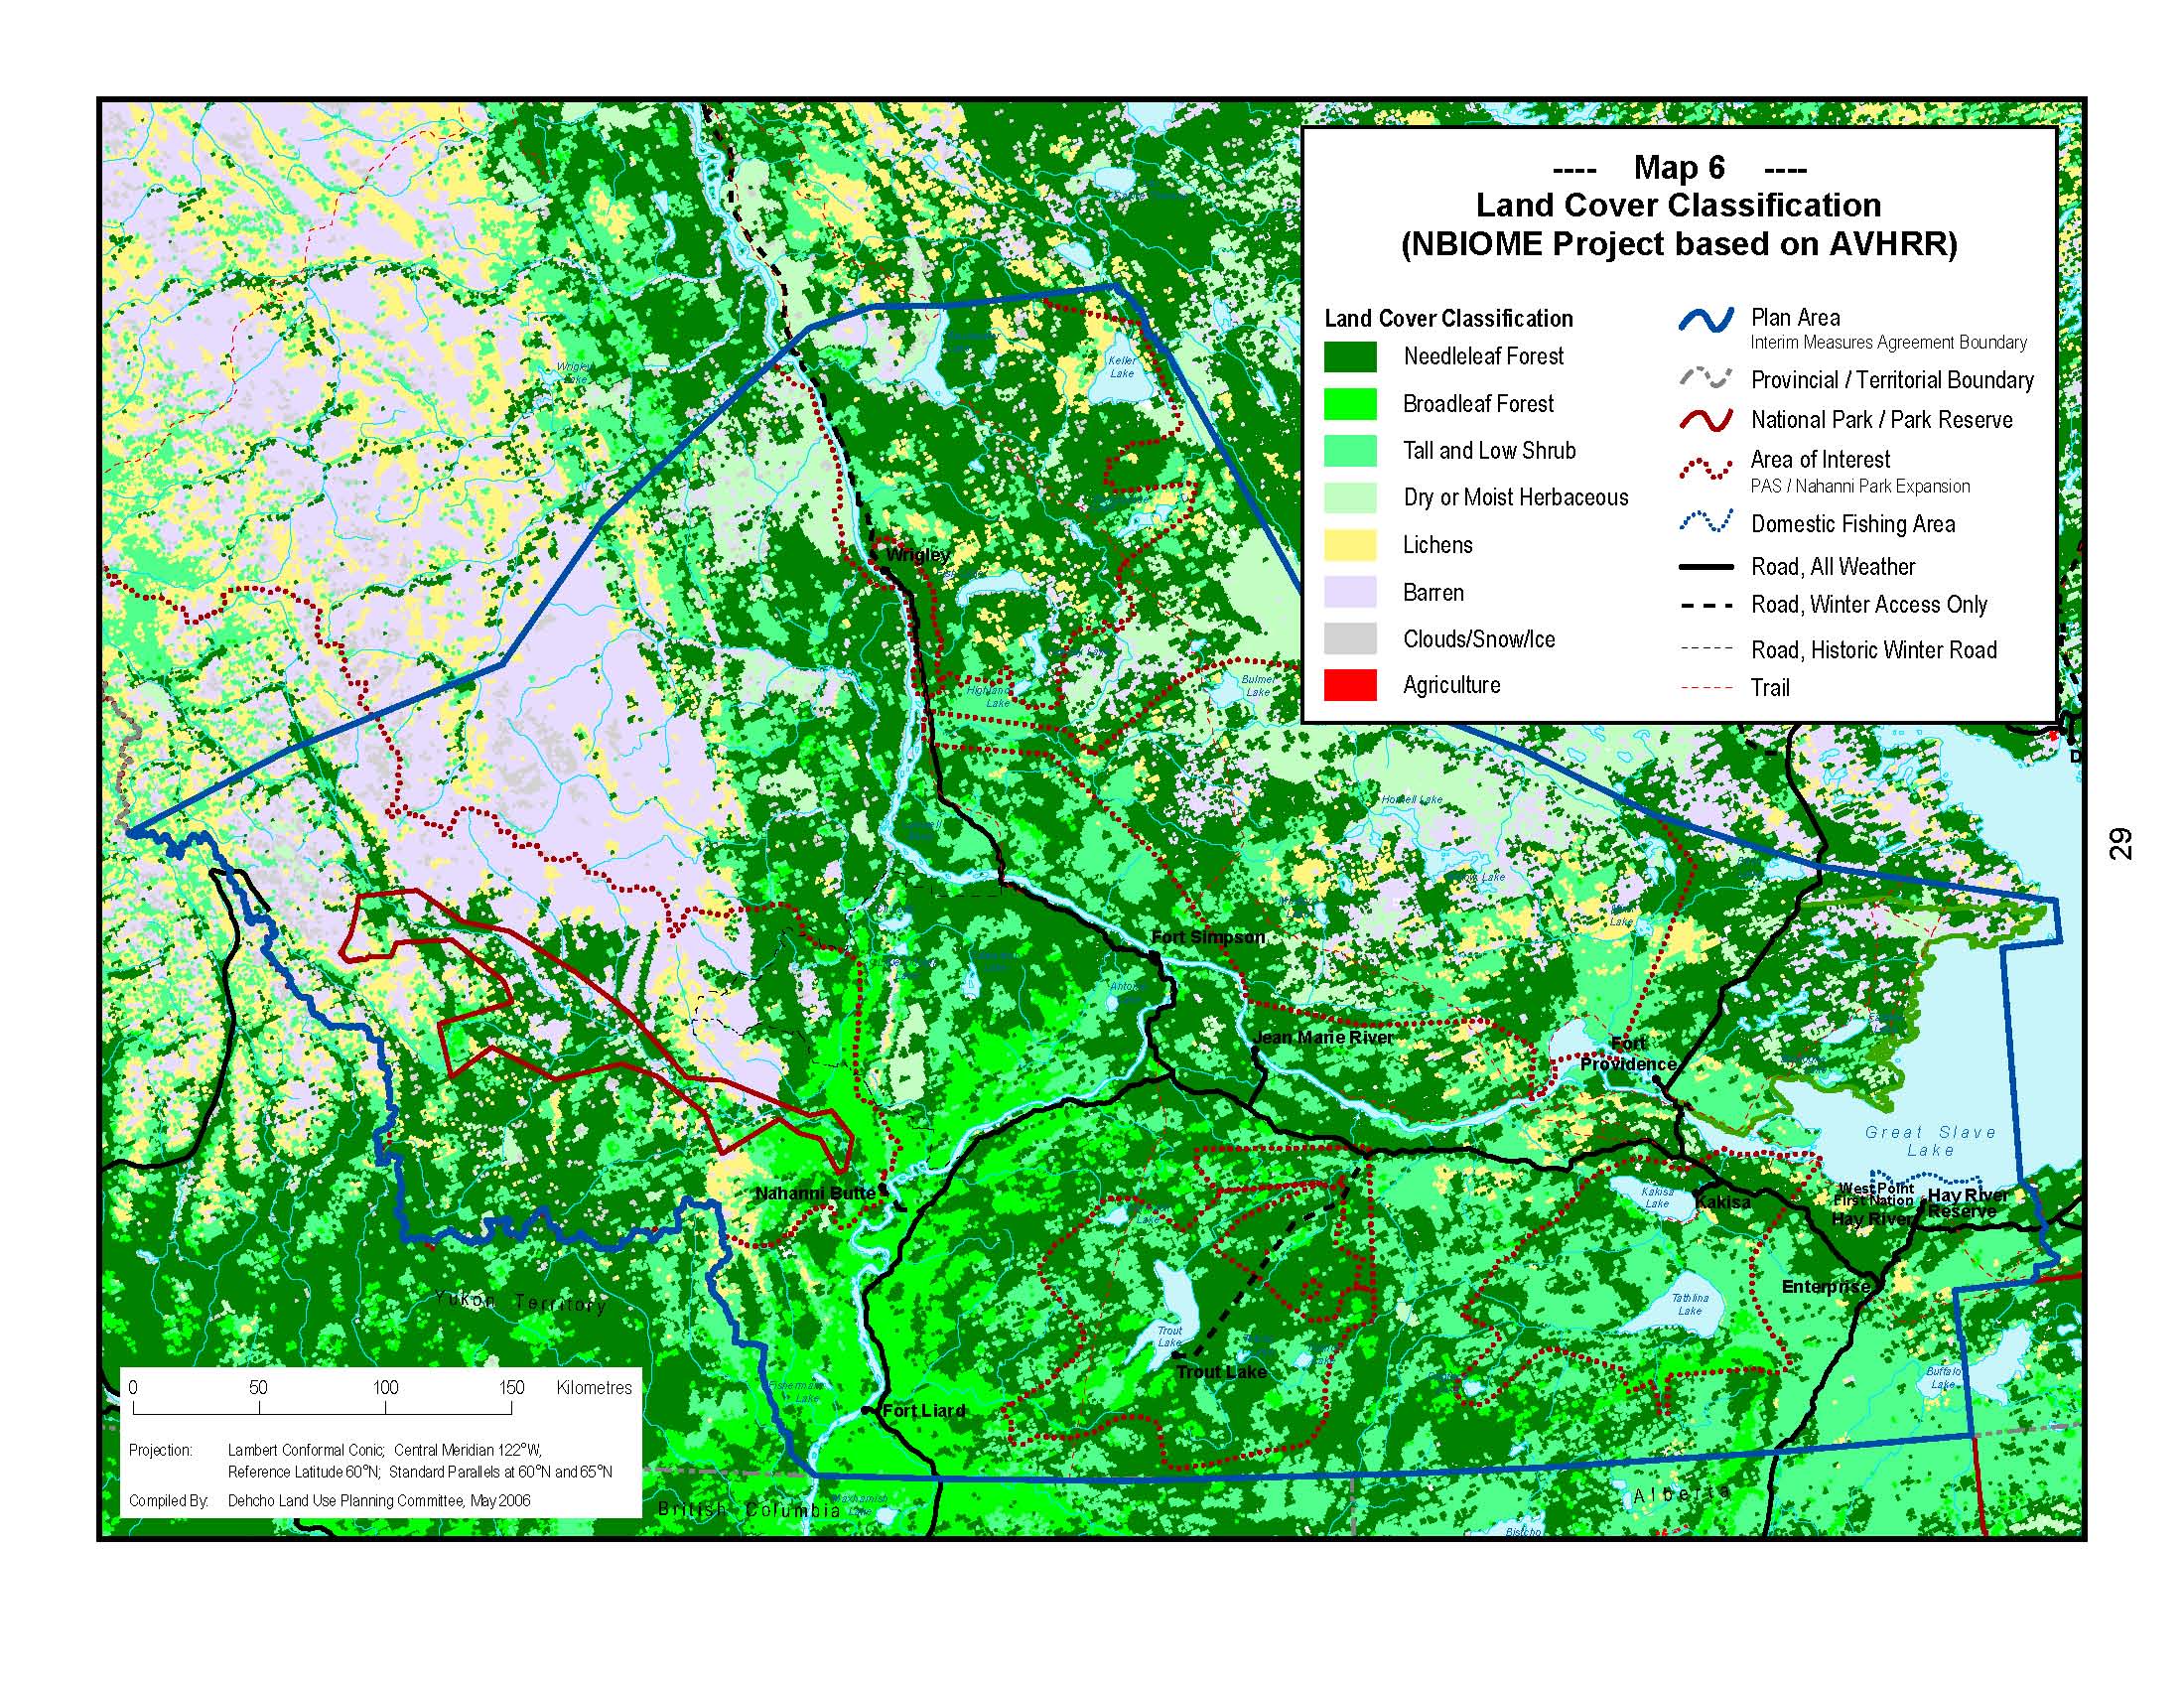
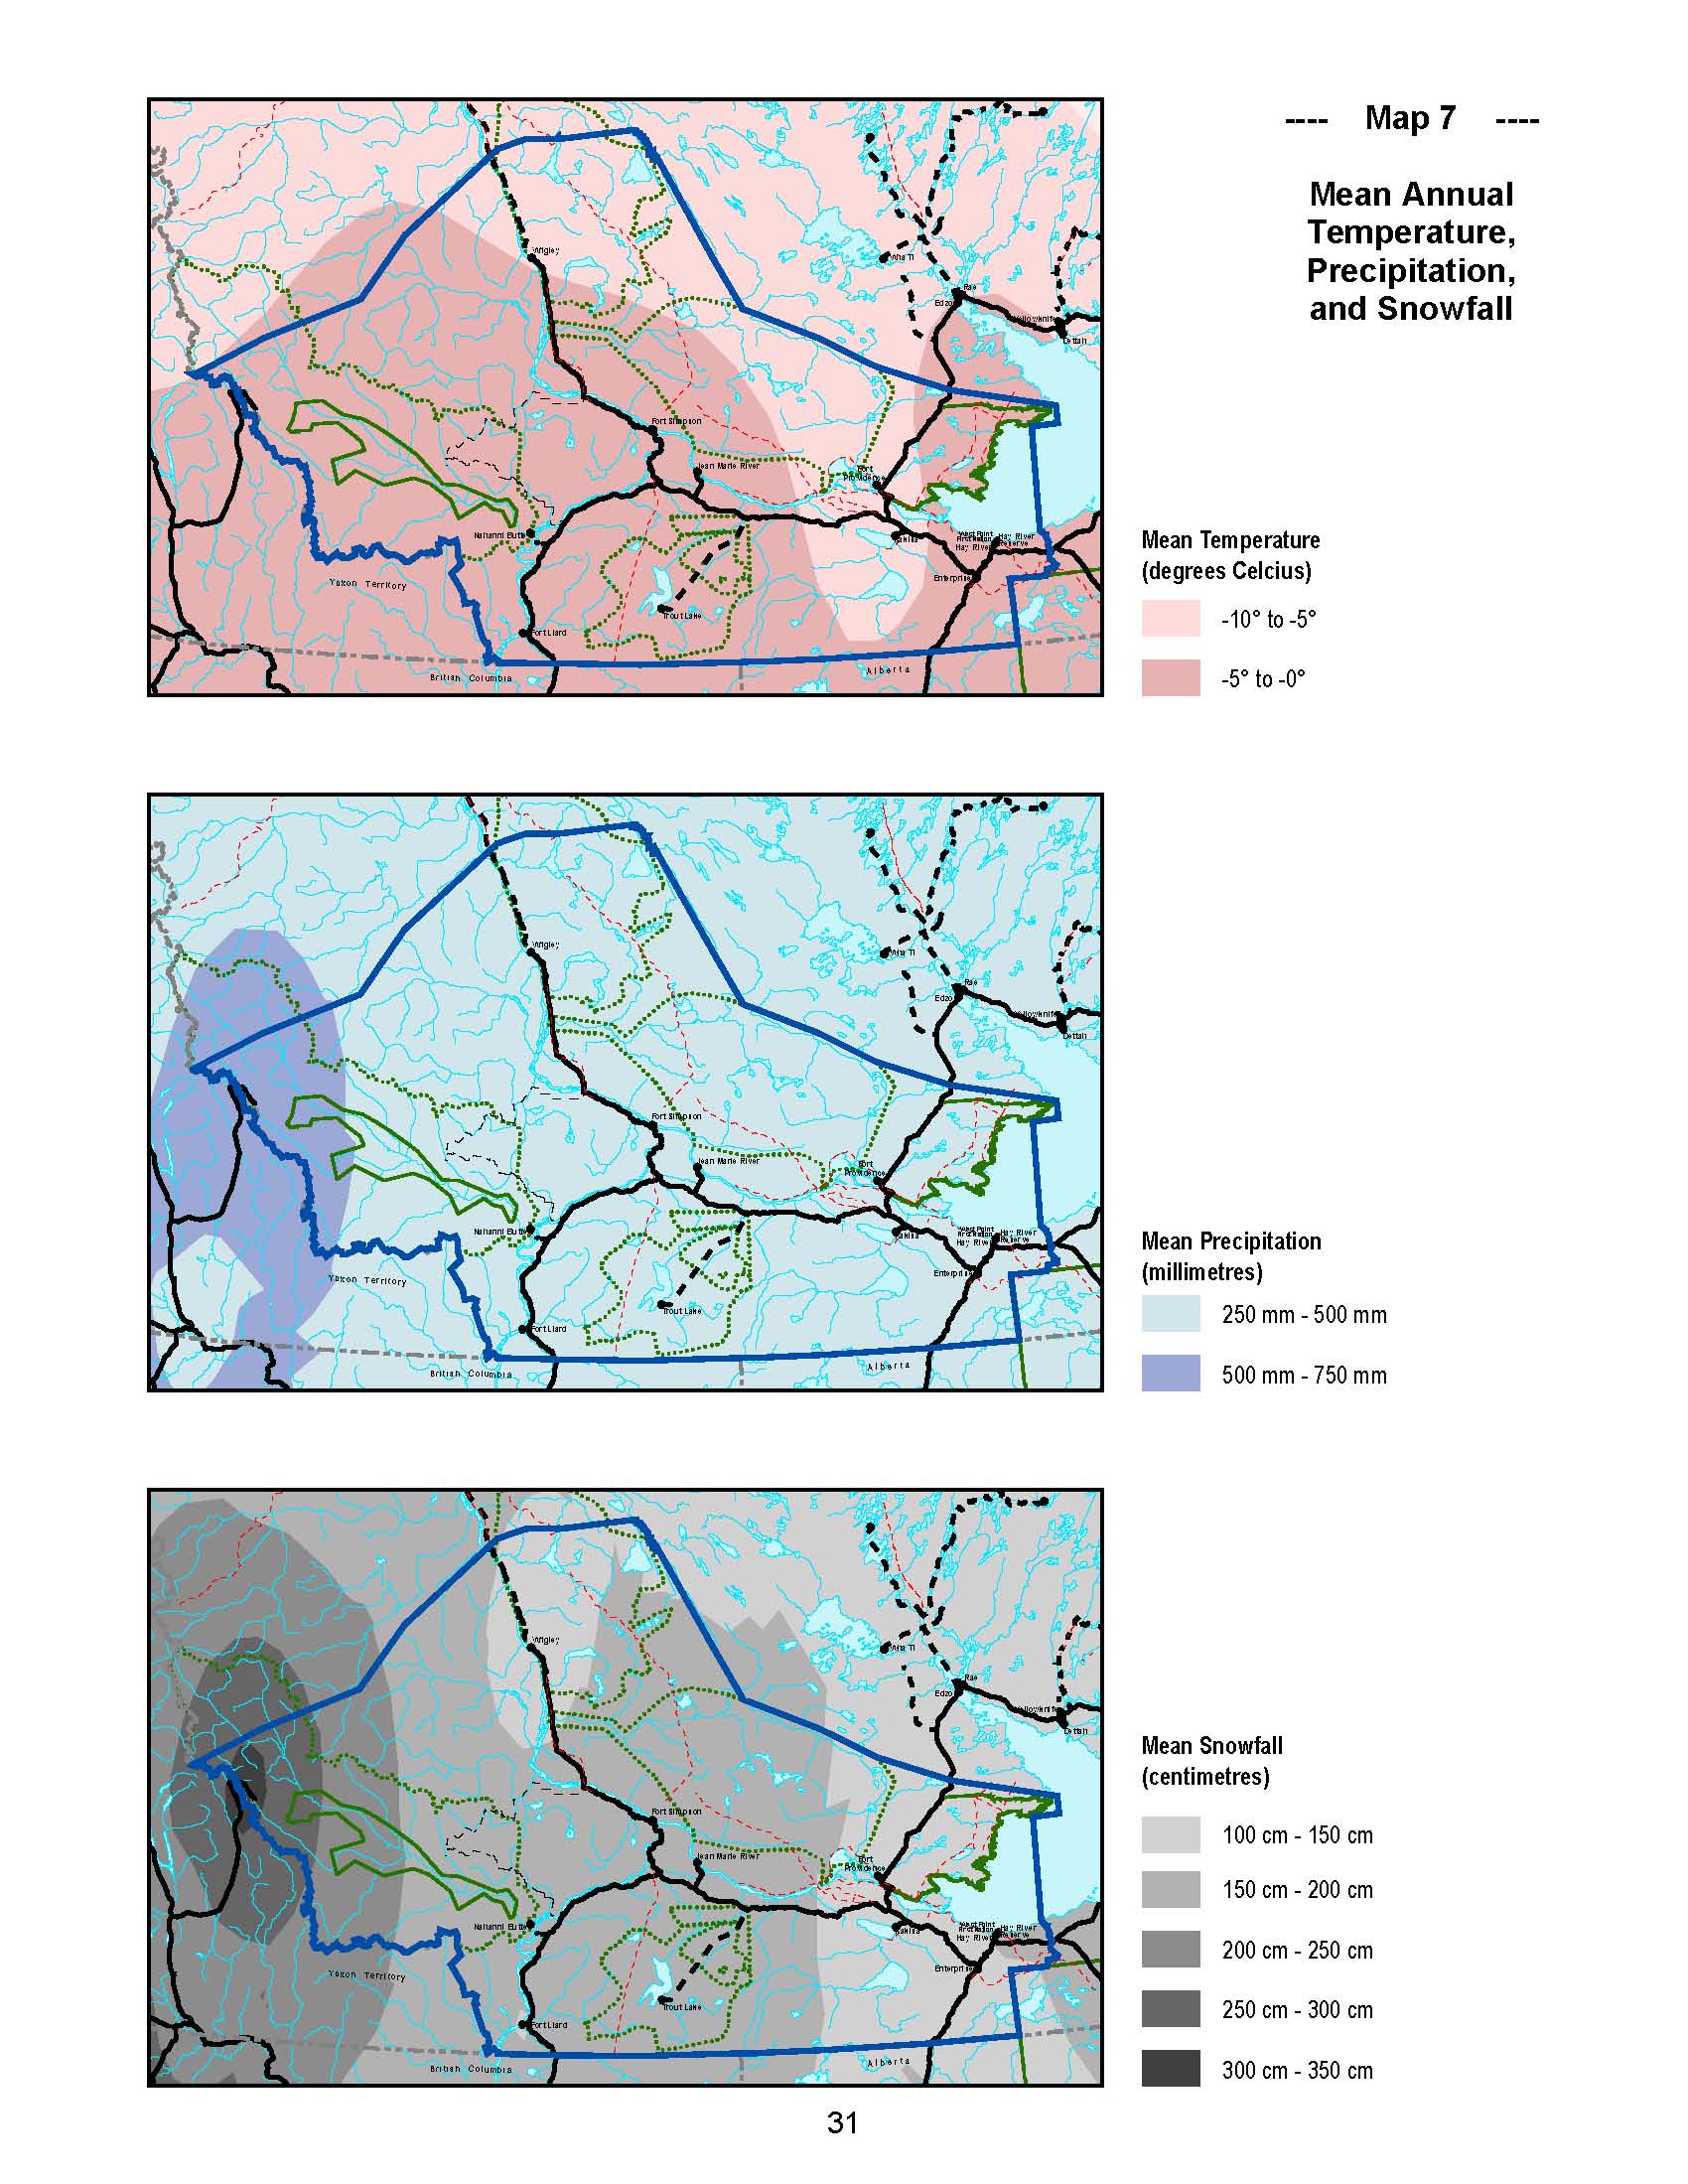
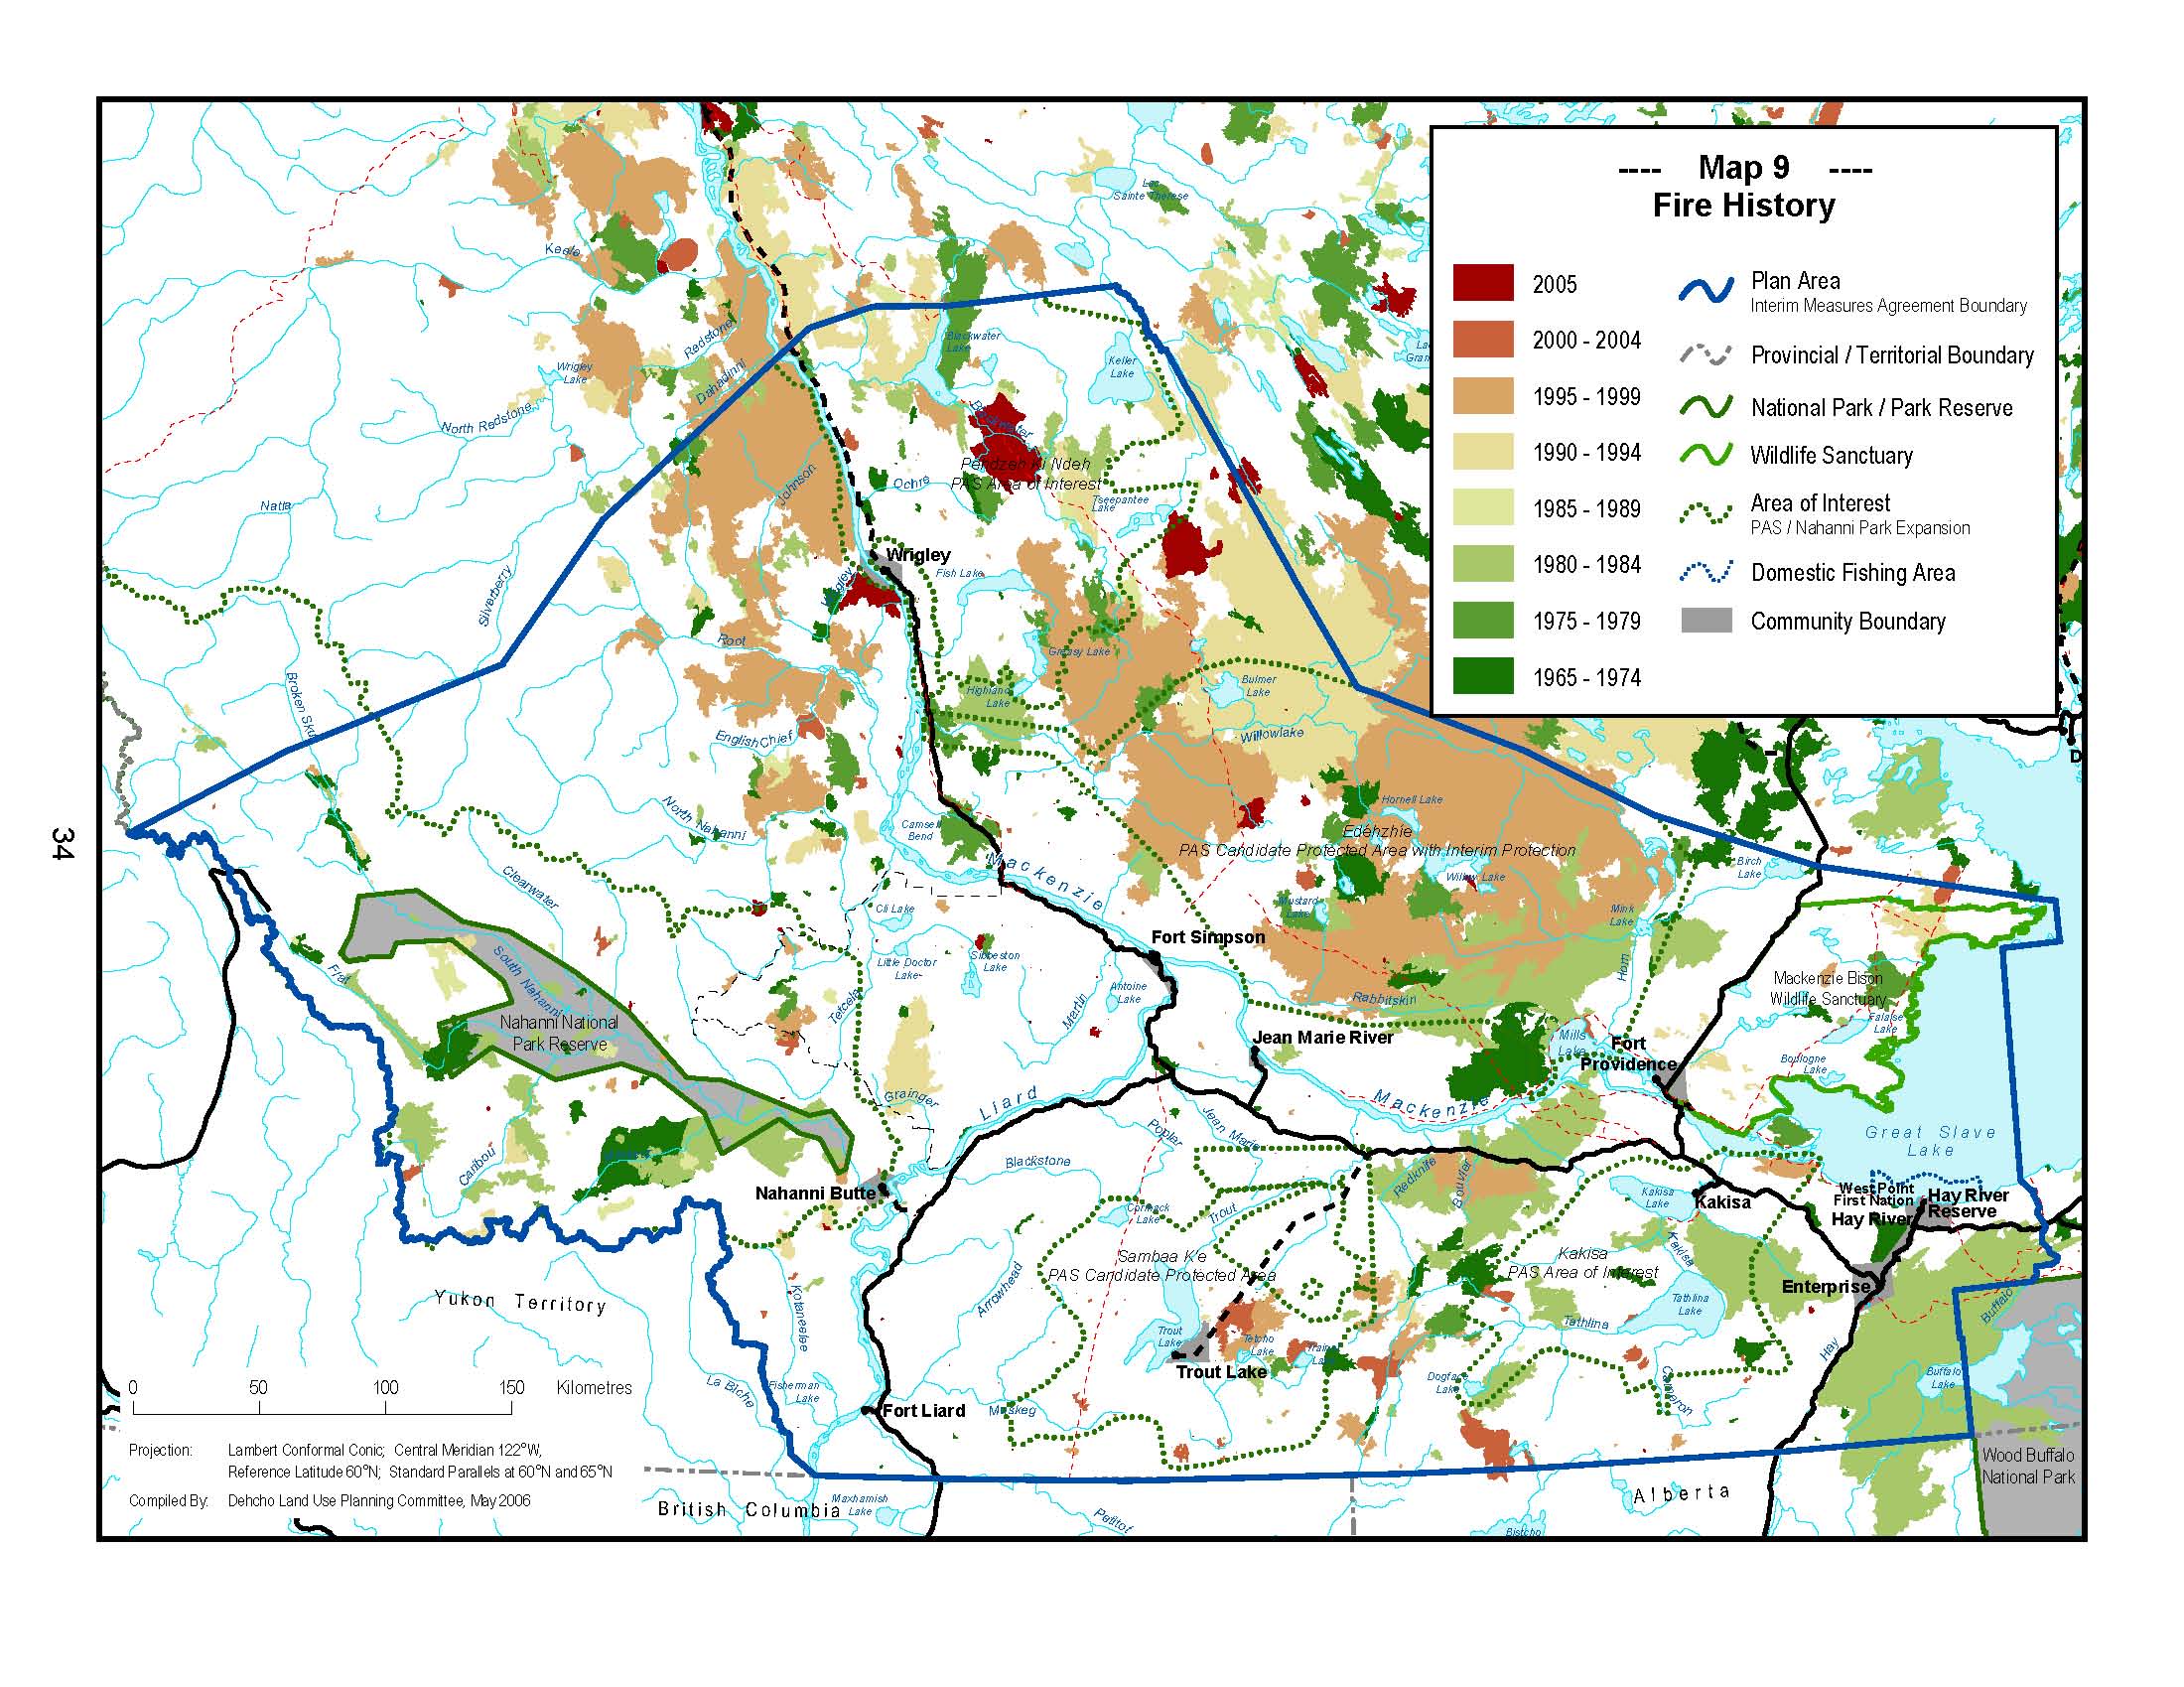
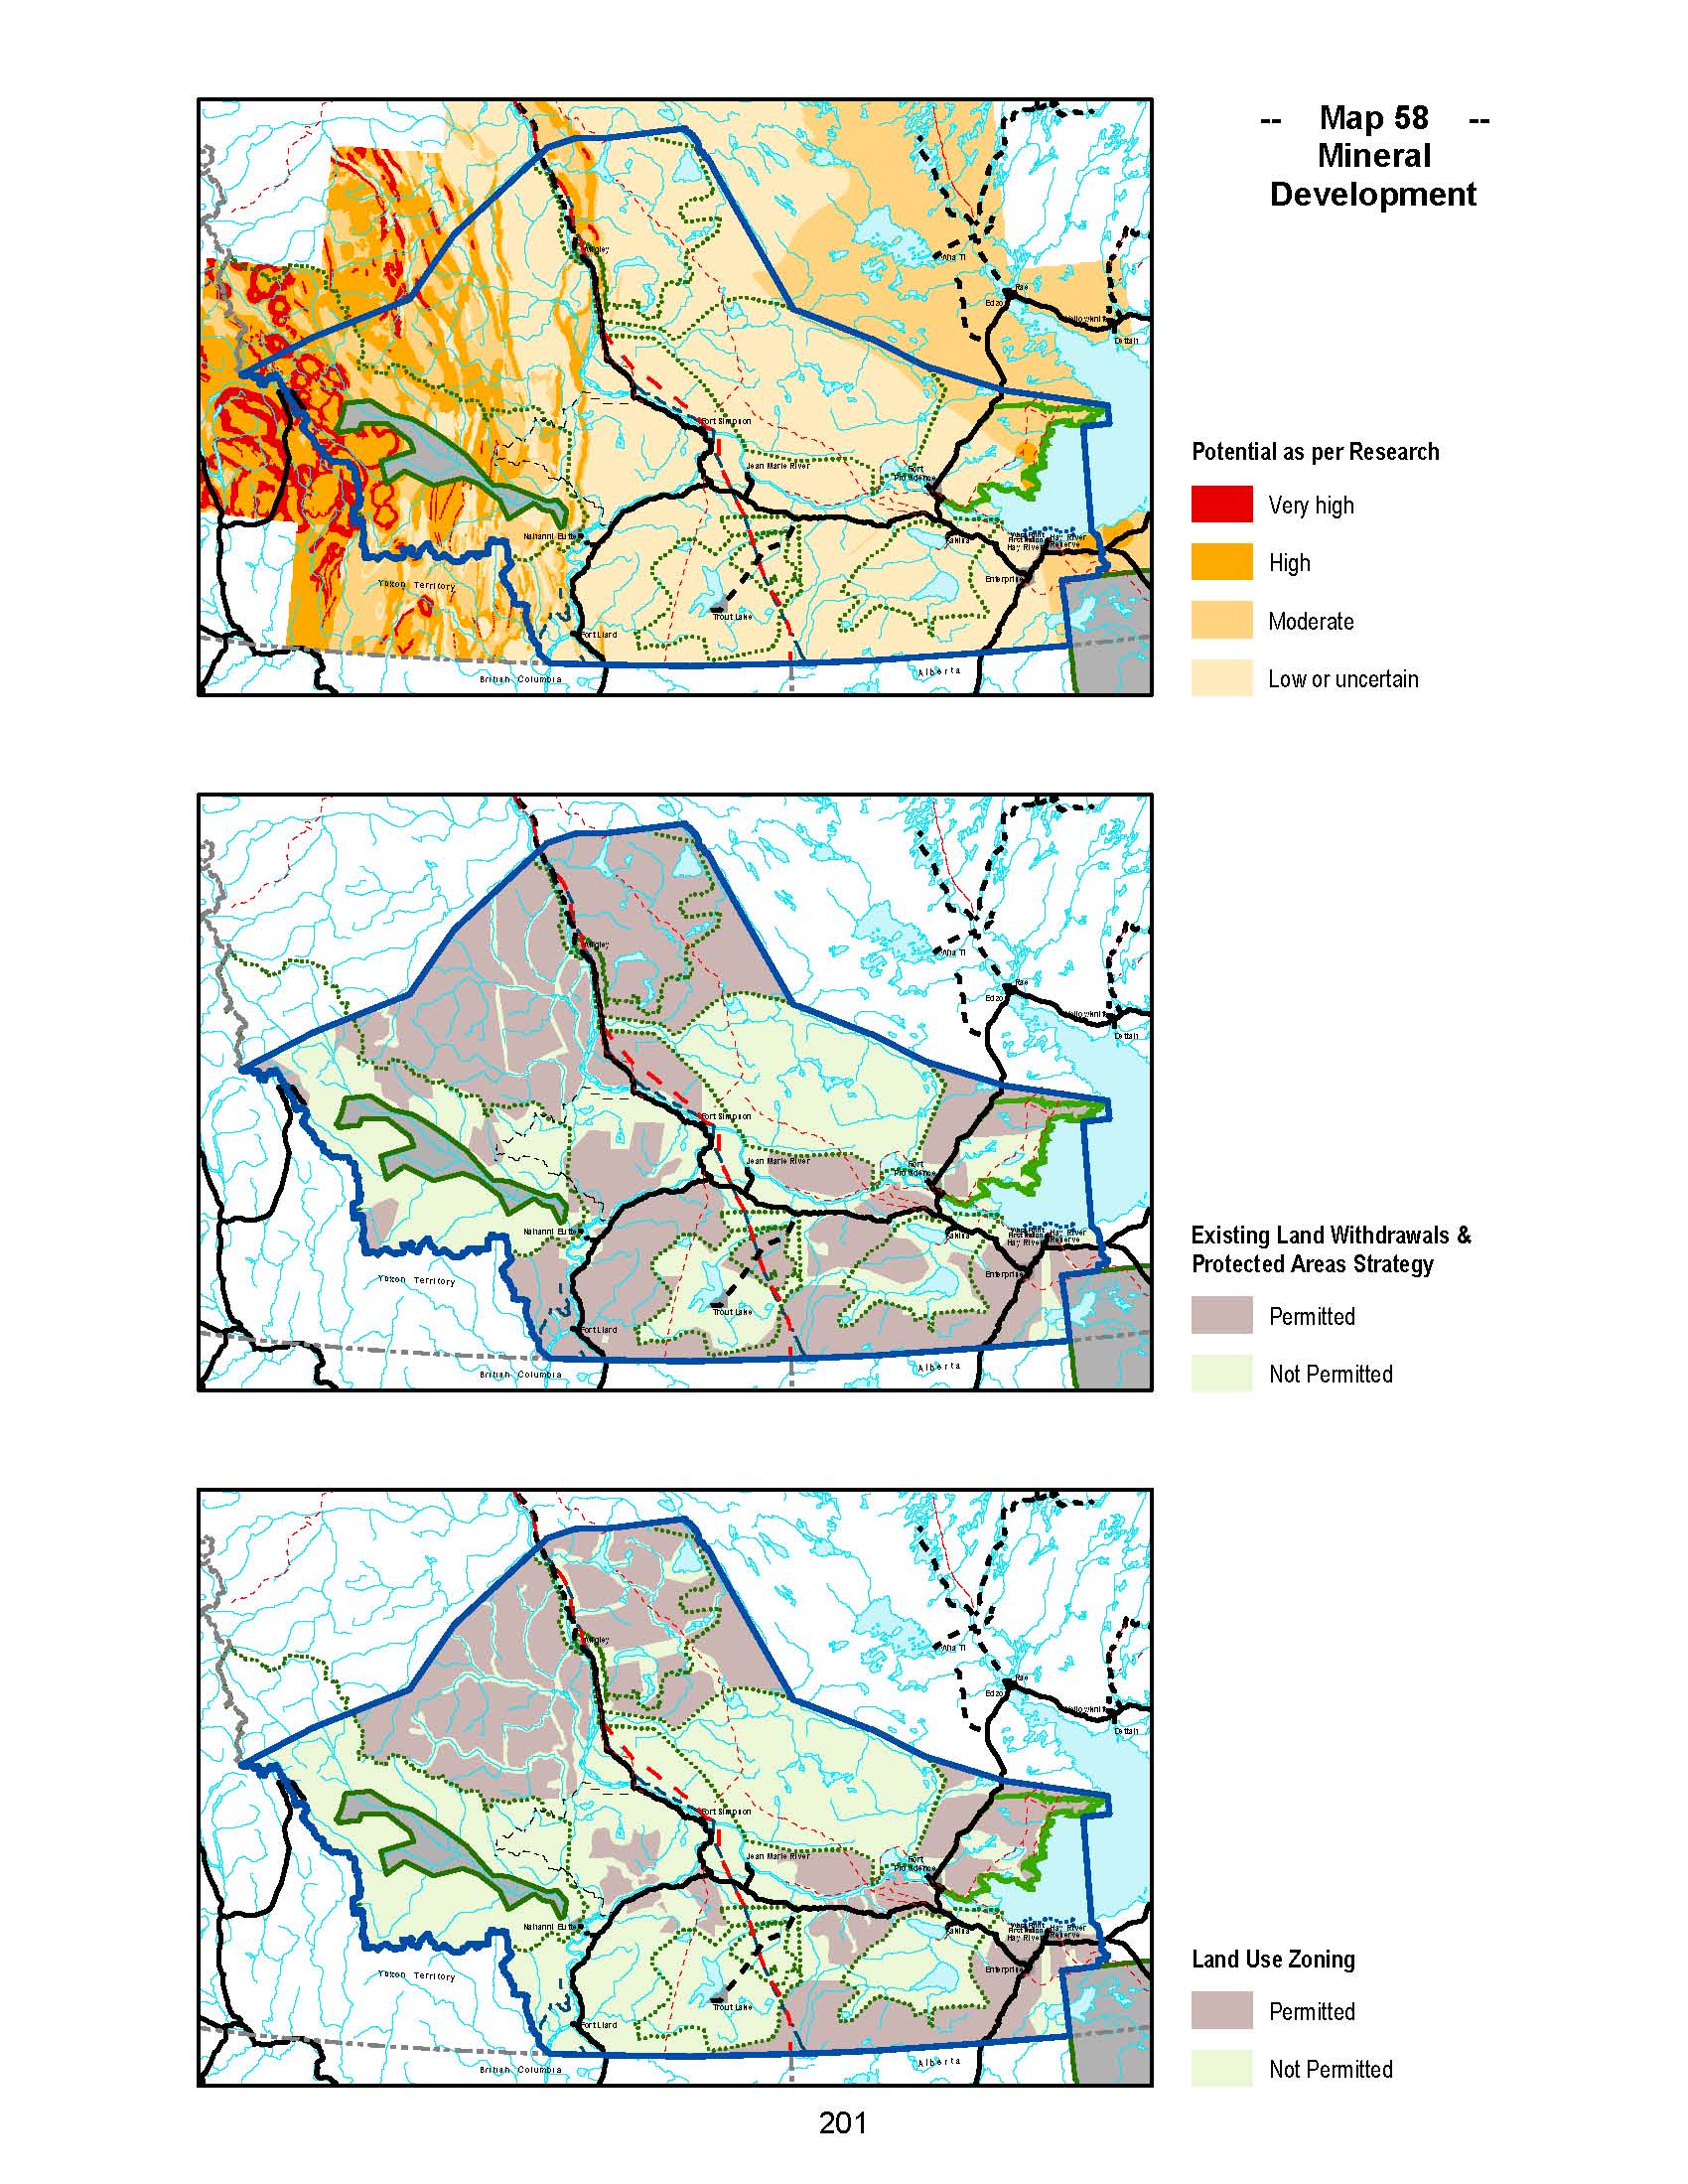
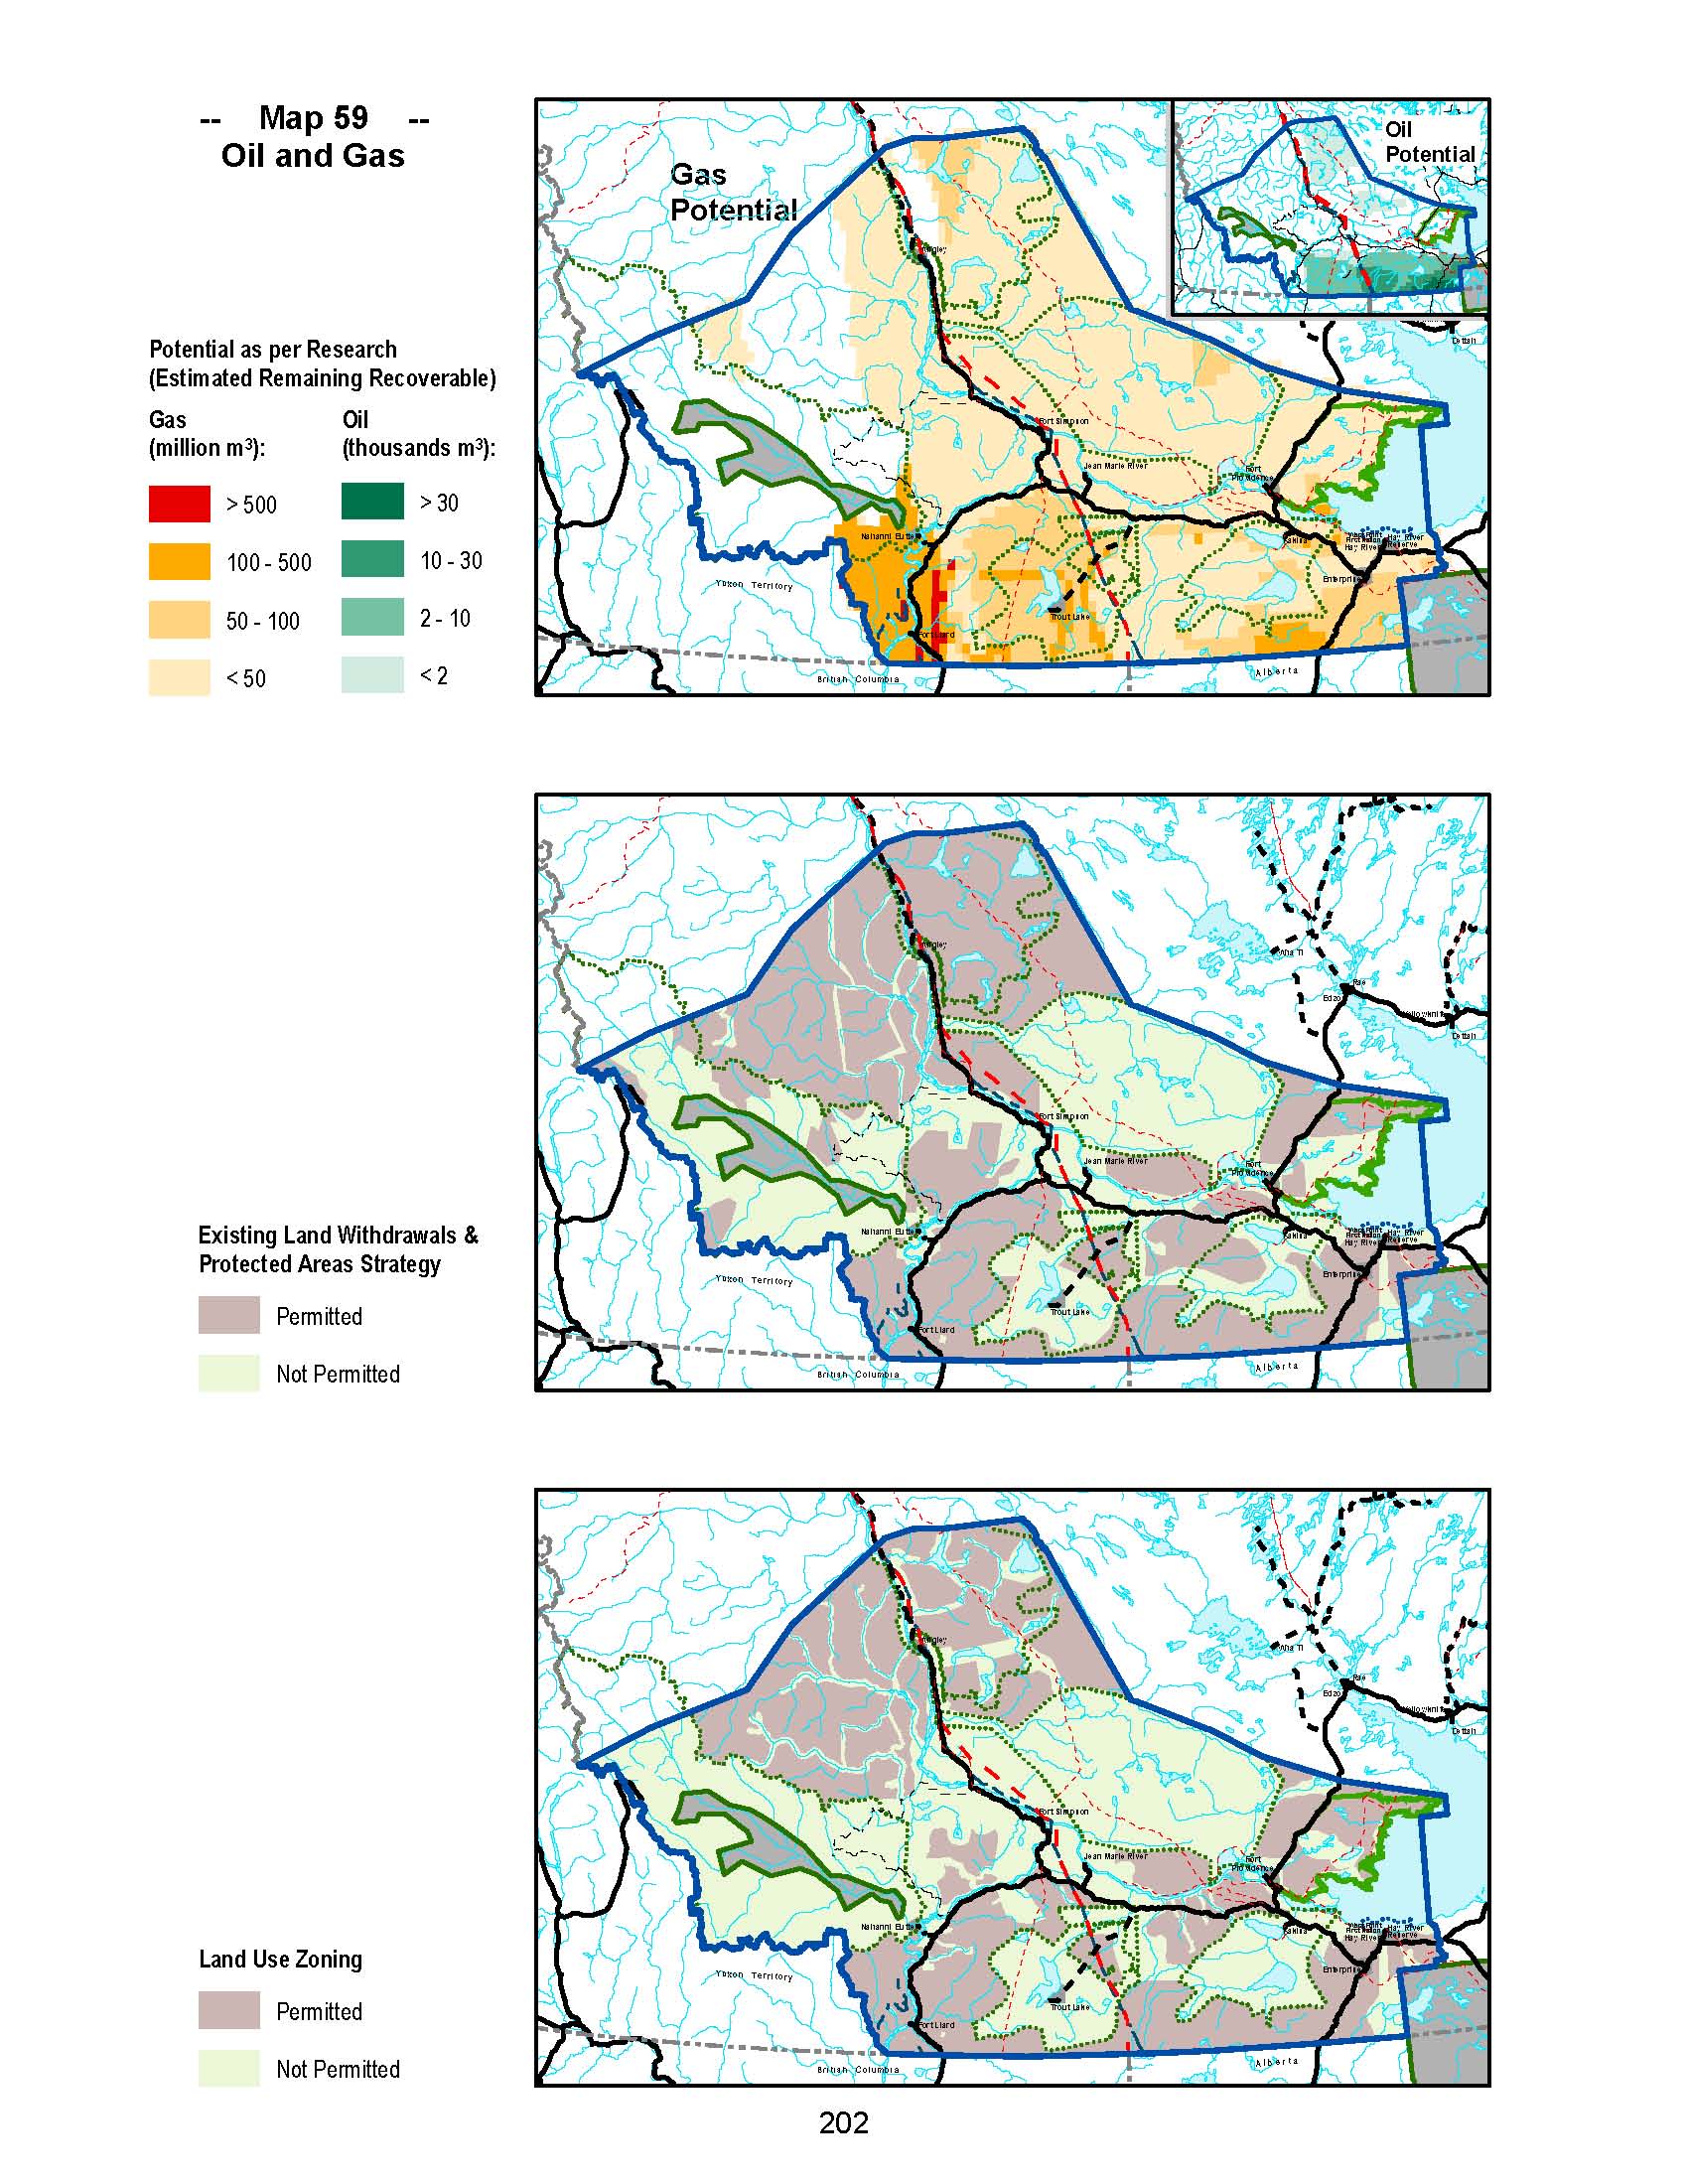
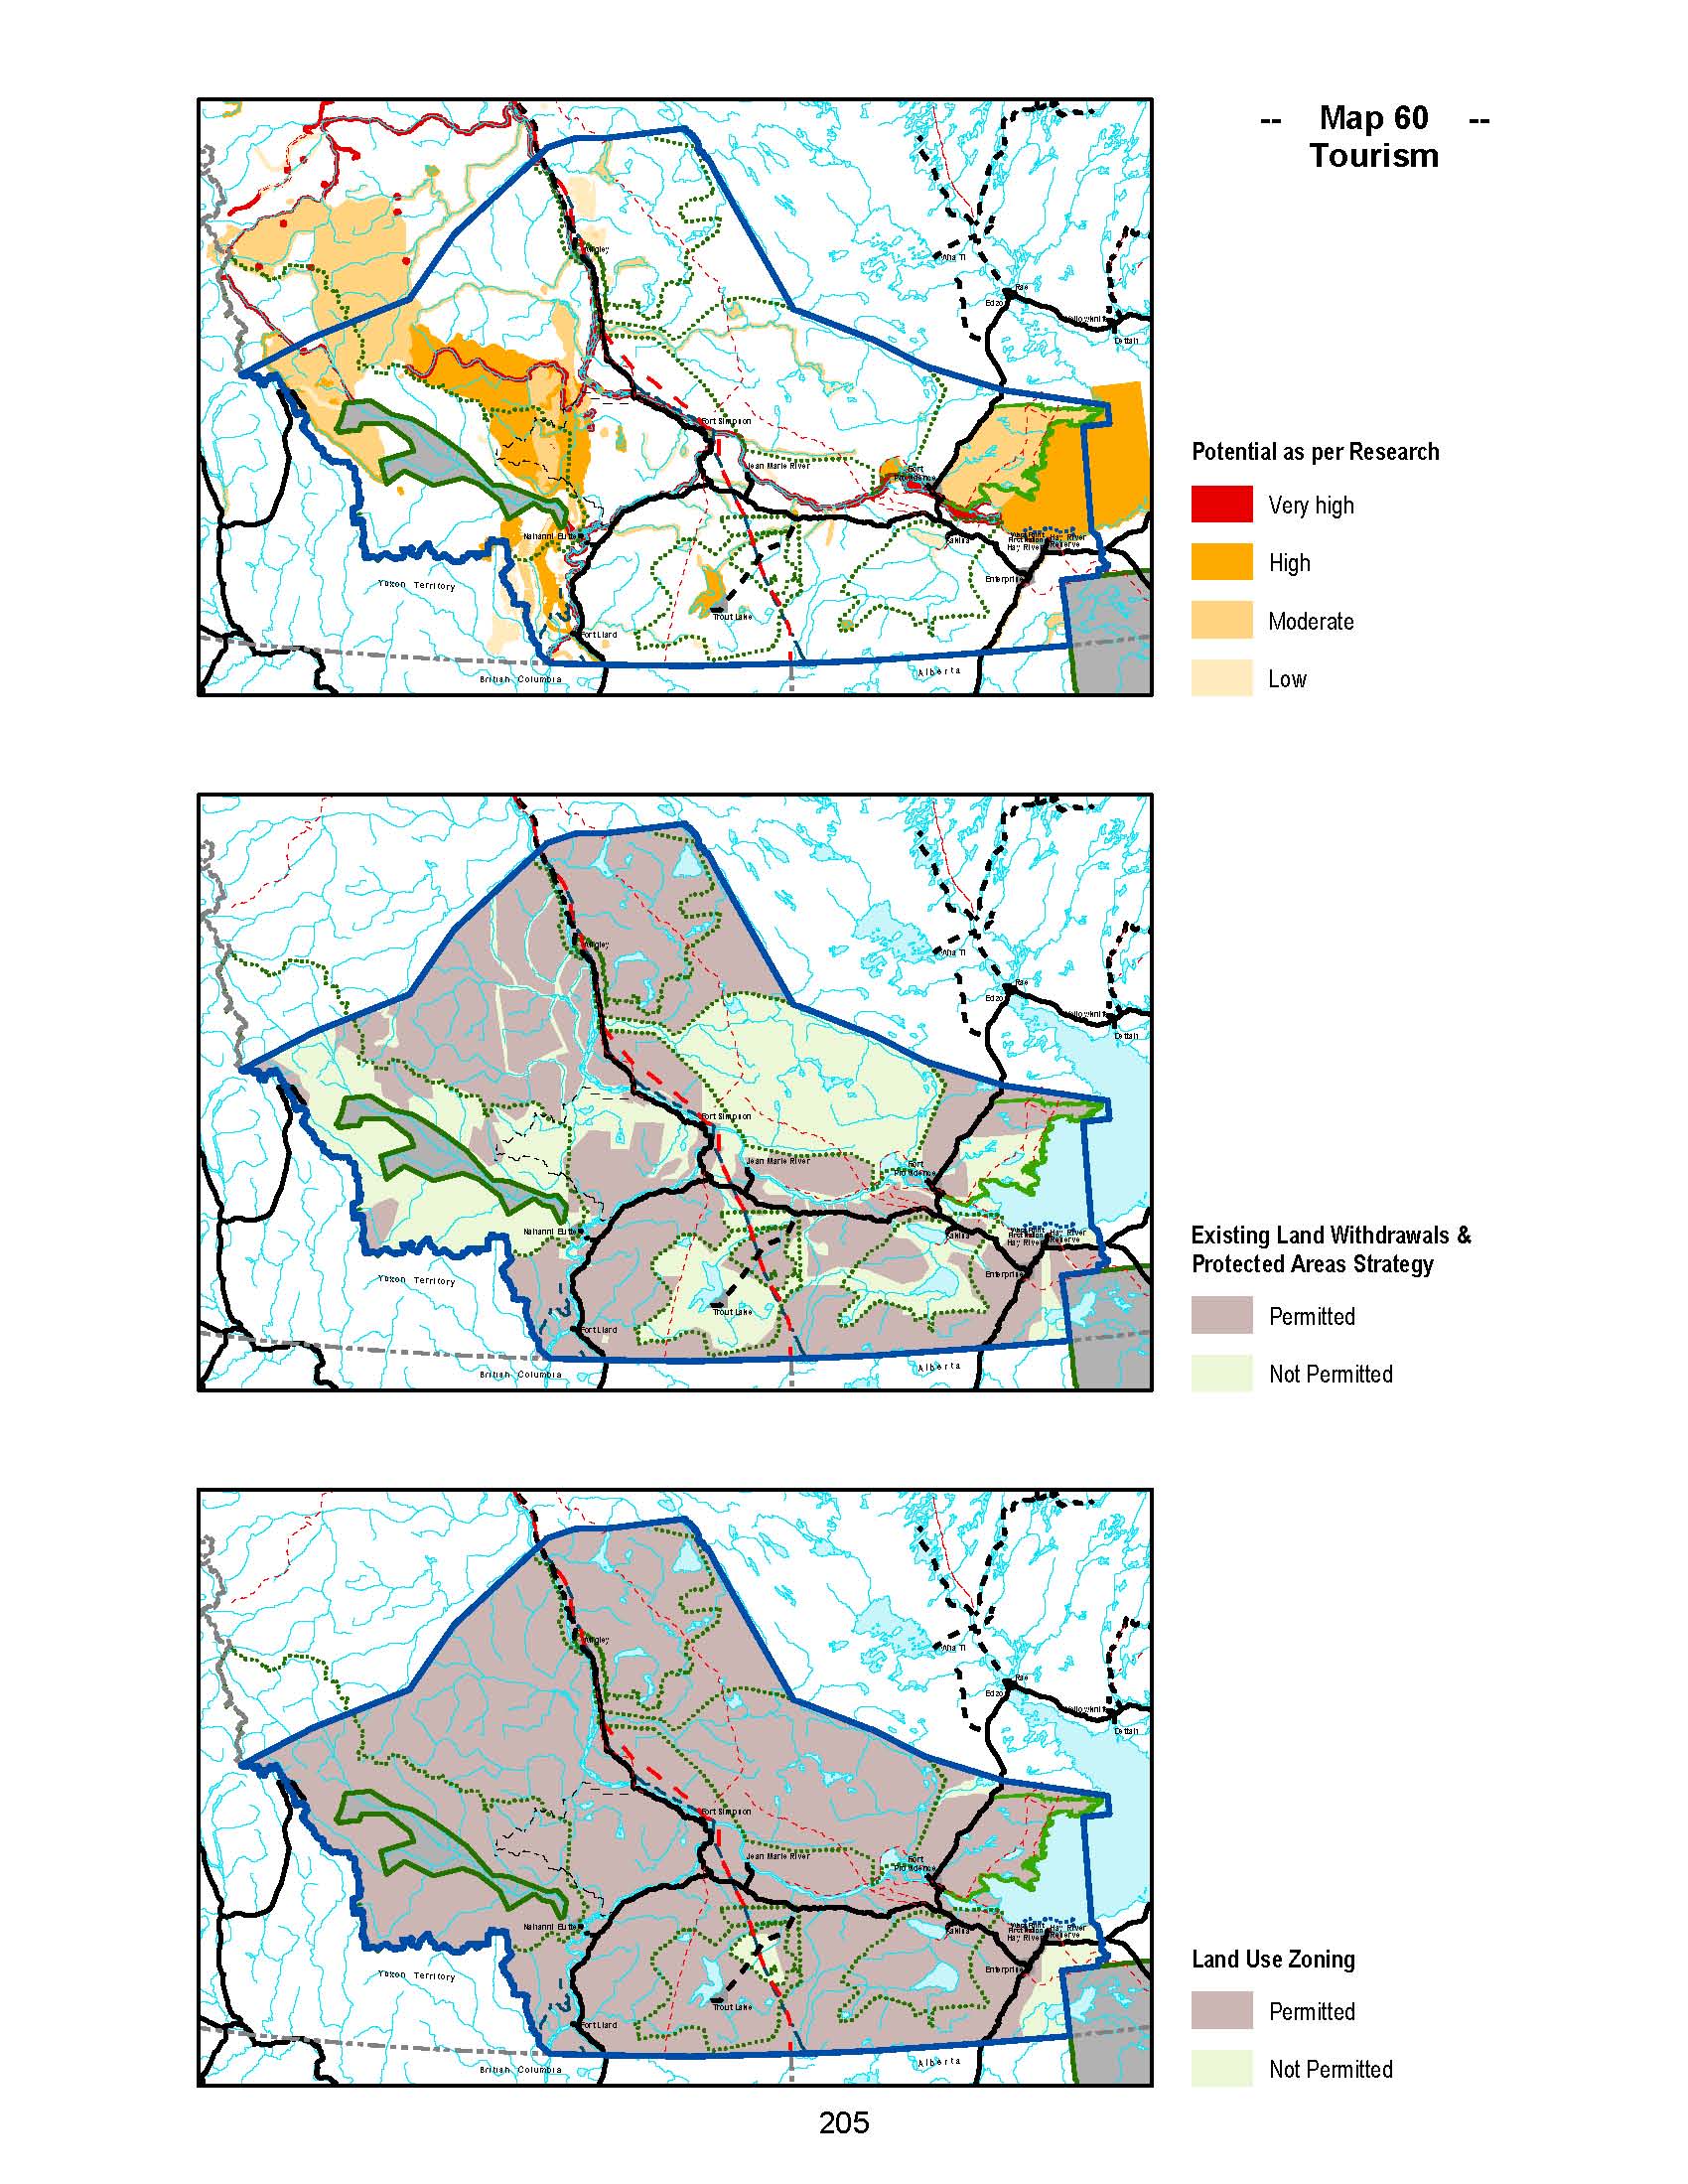
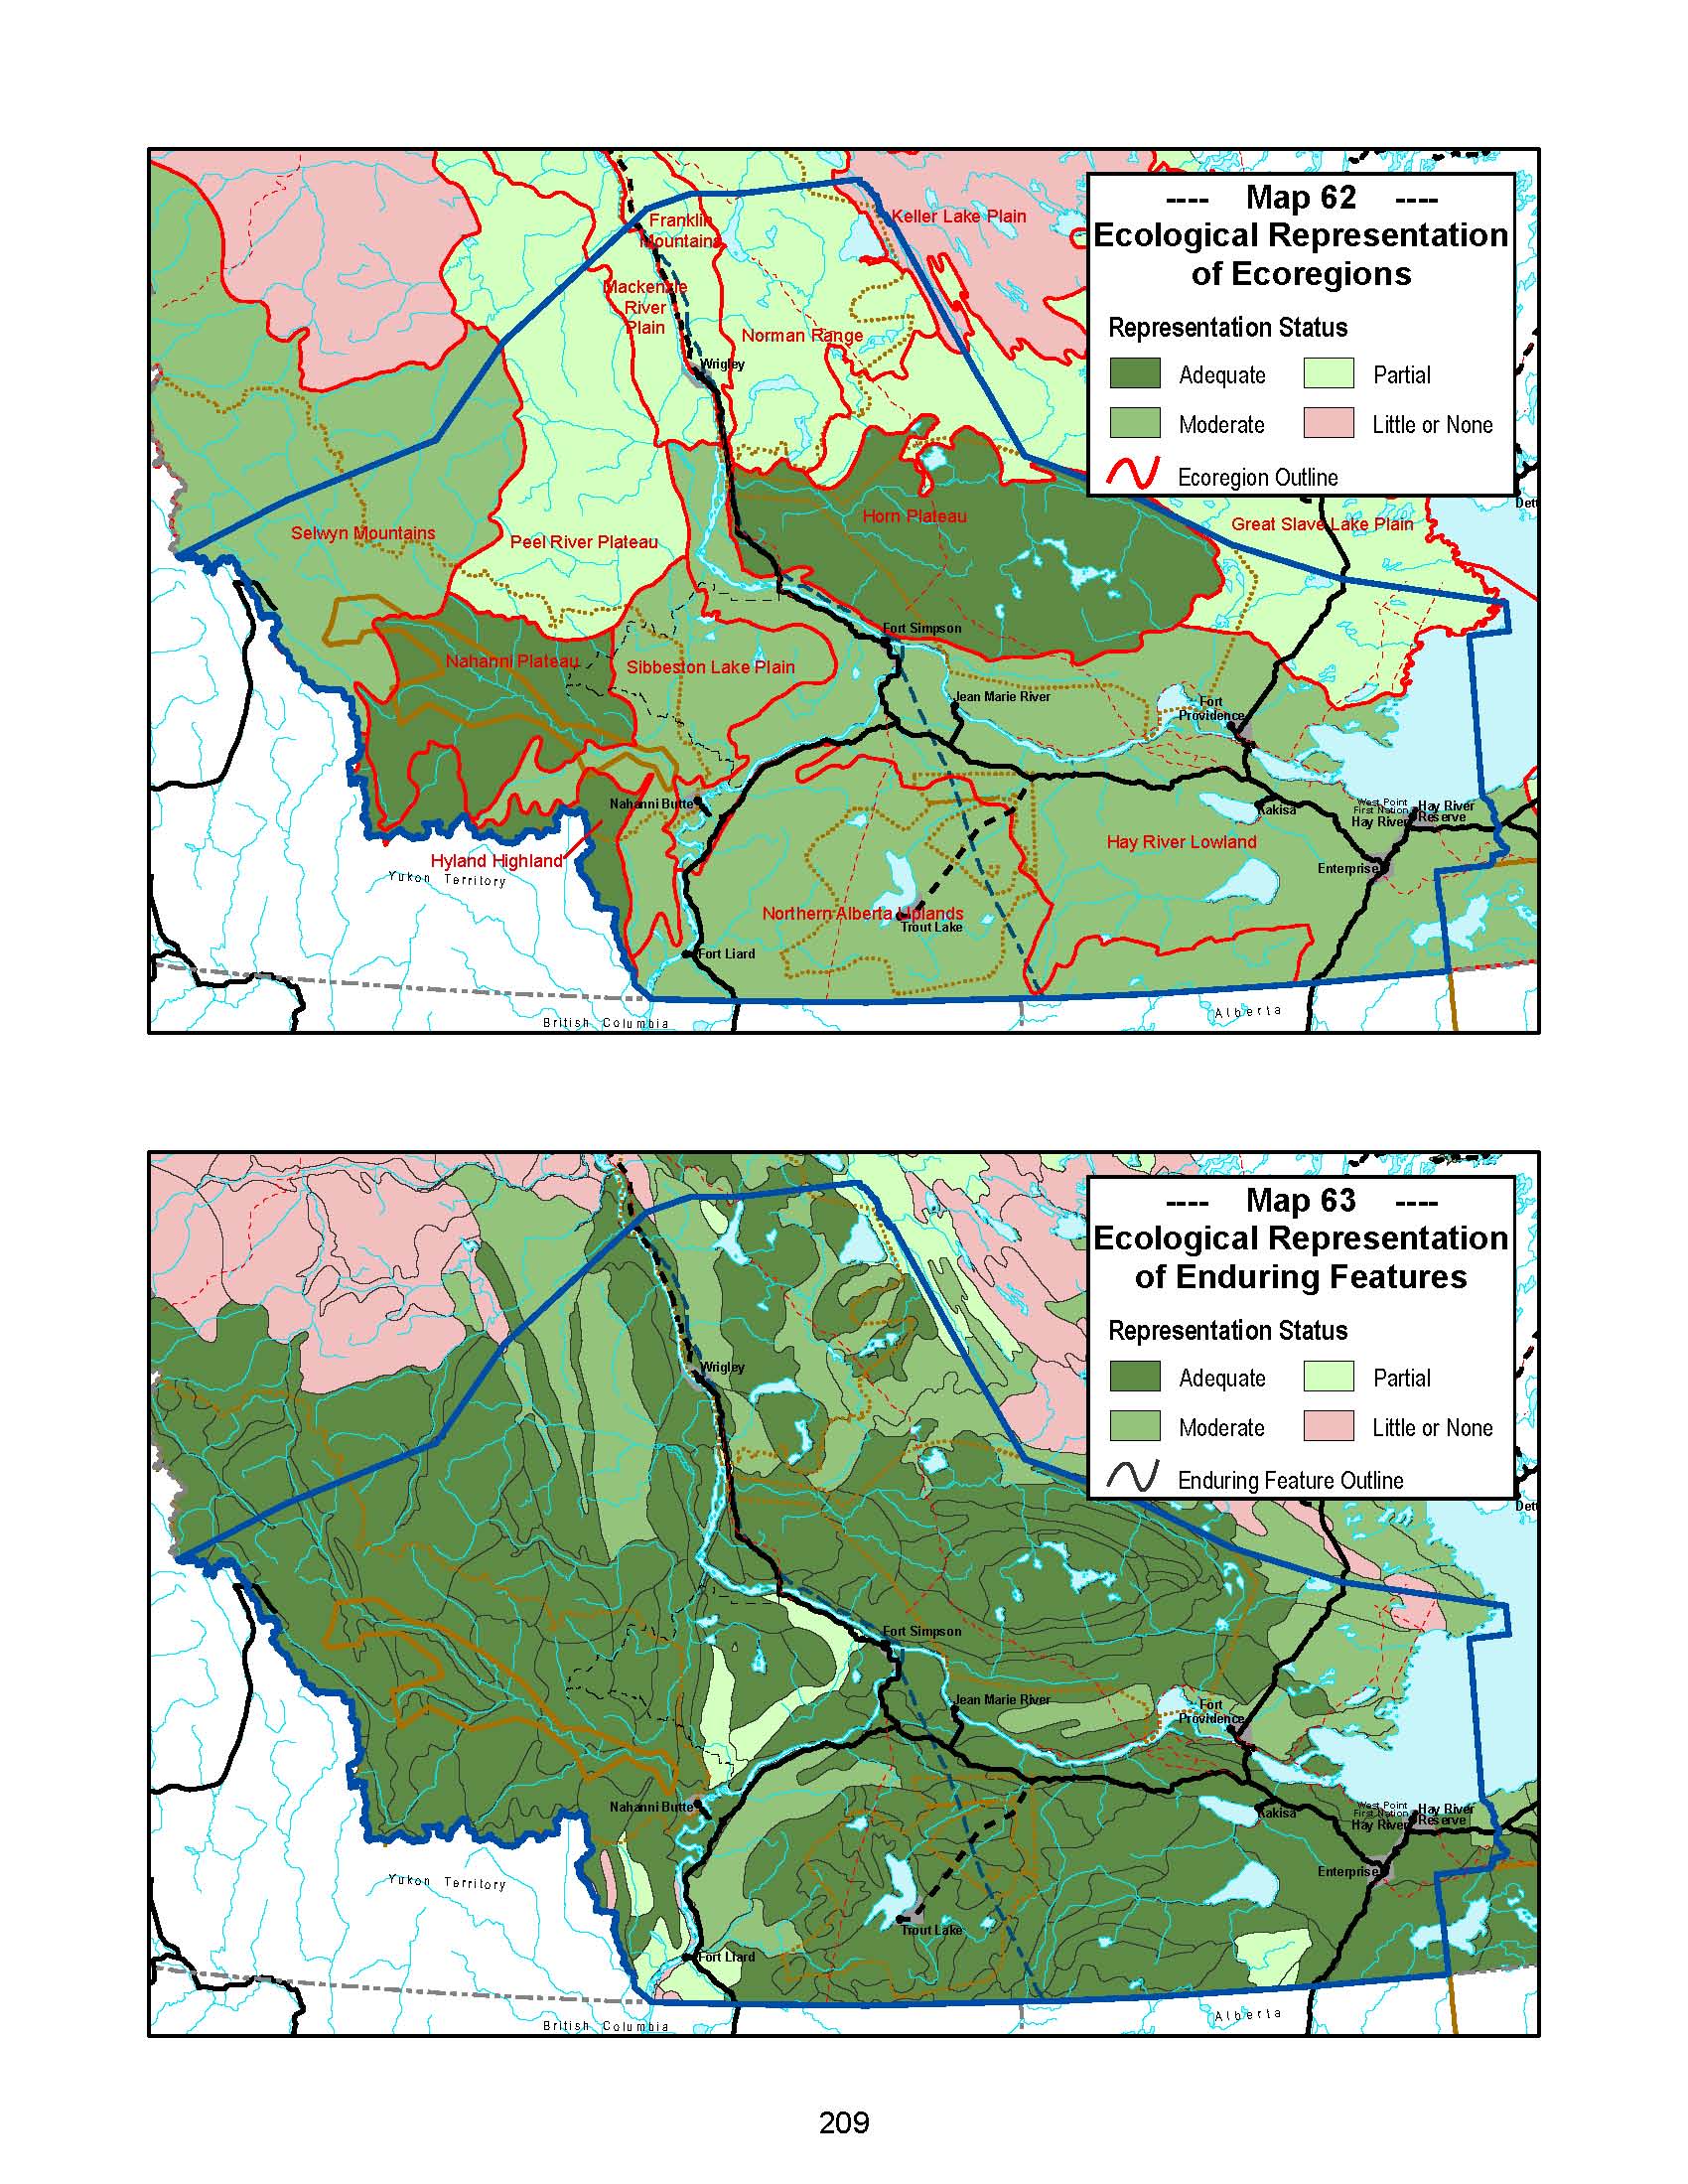
IMPORTANT: These maps are historic. They may be out of date and no longer accurate. Contact the Dehcho Land Use Planning Committee for more current information at dclandplan@ssimicro.com.​

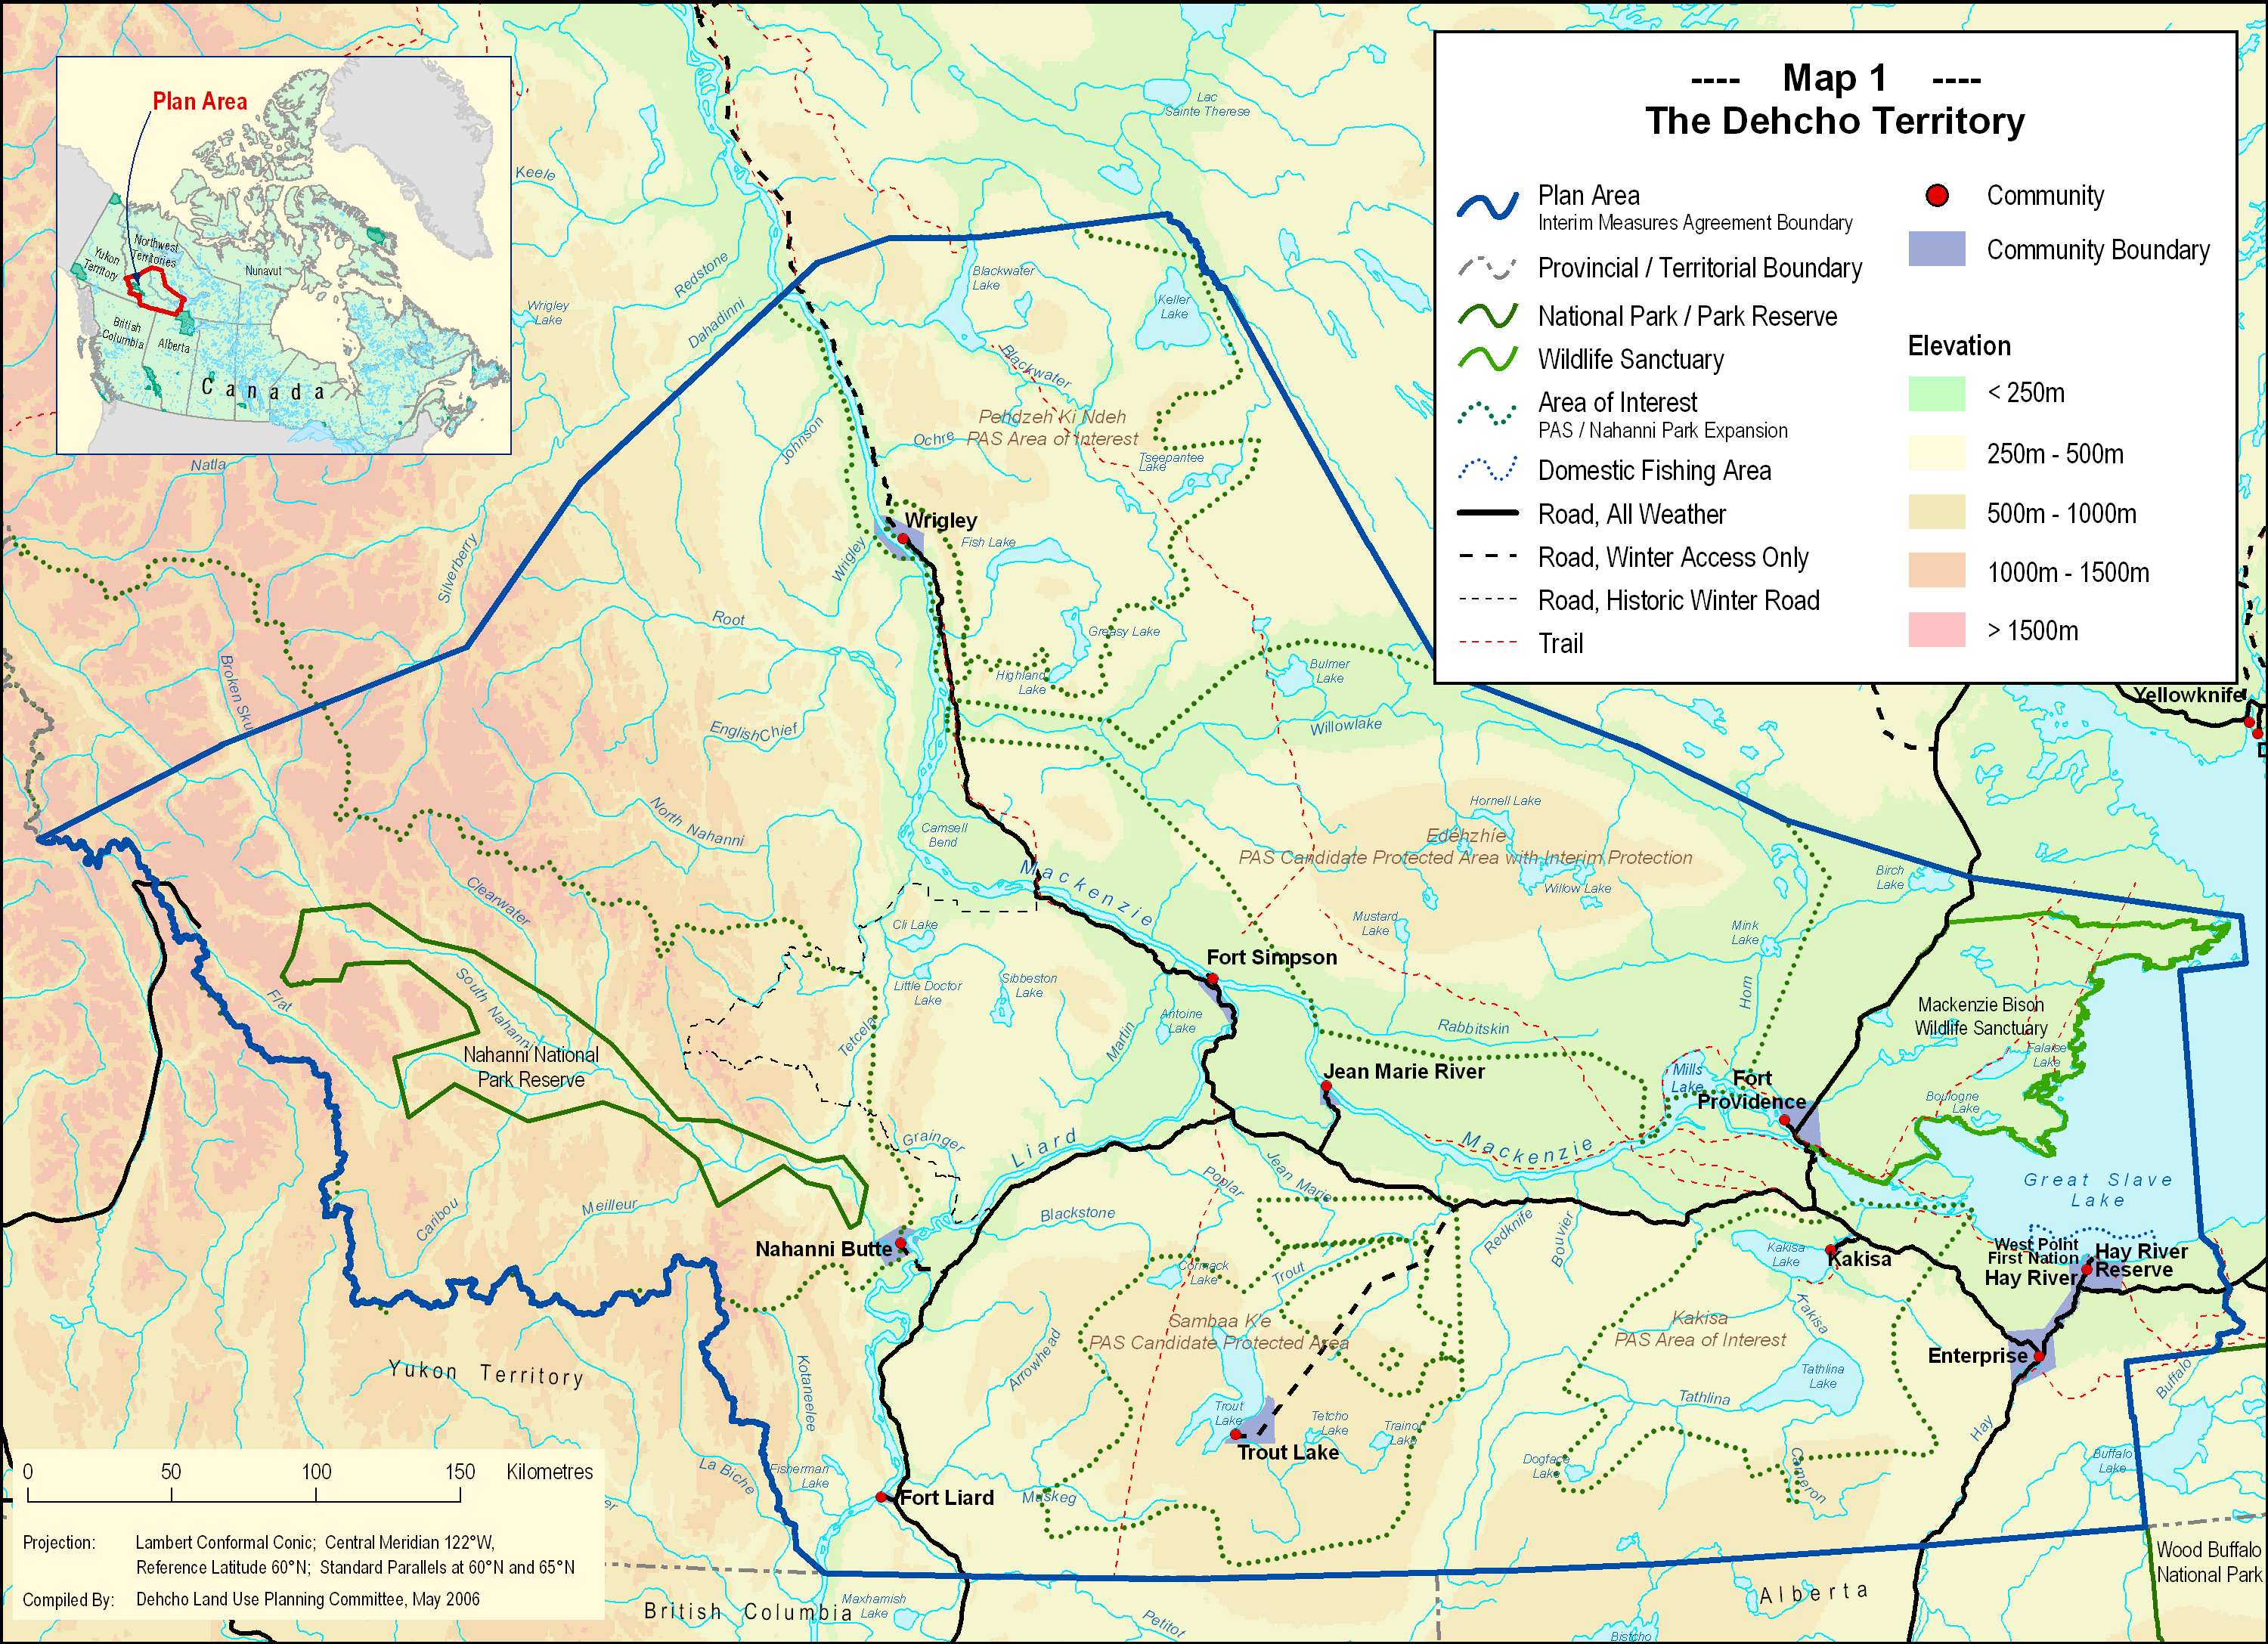
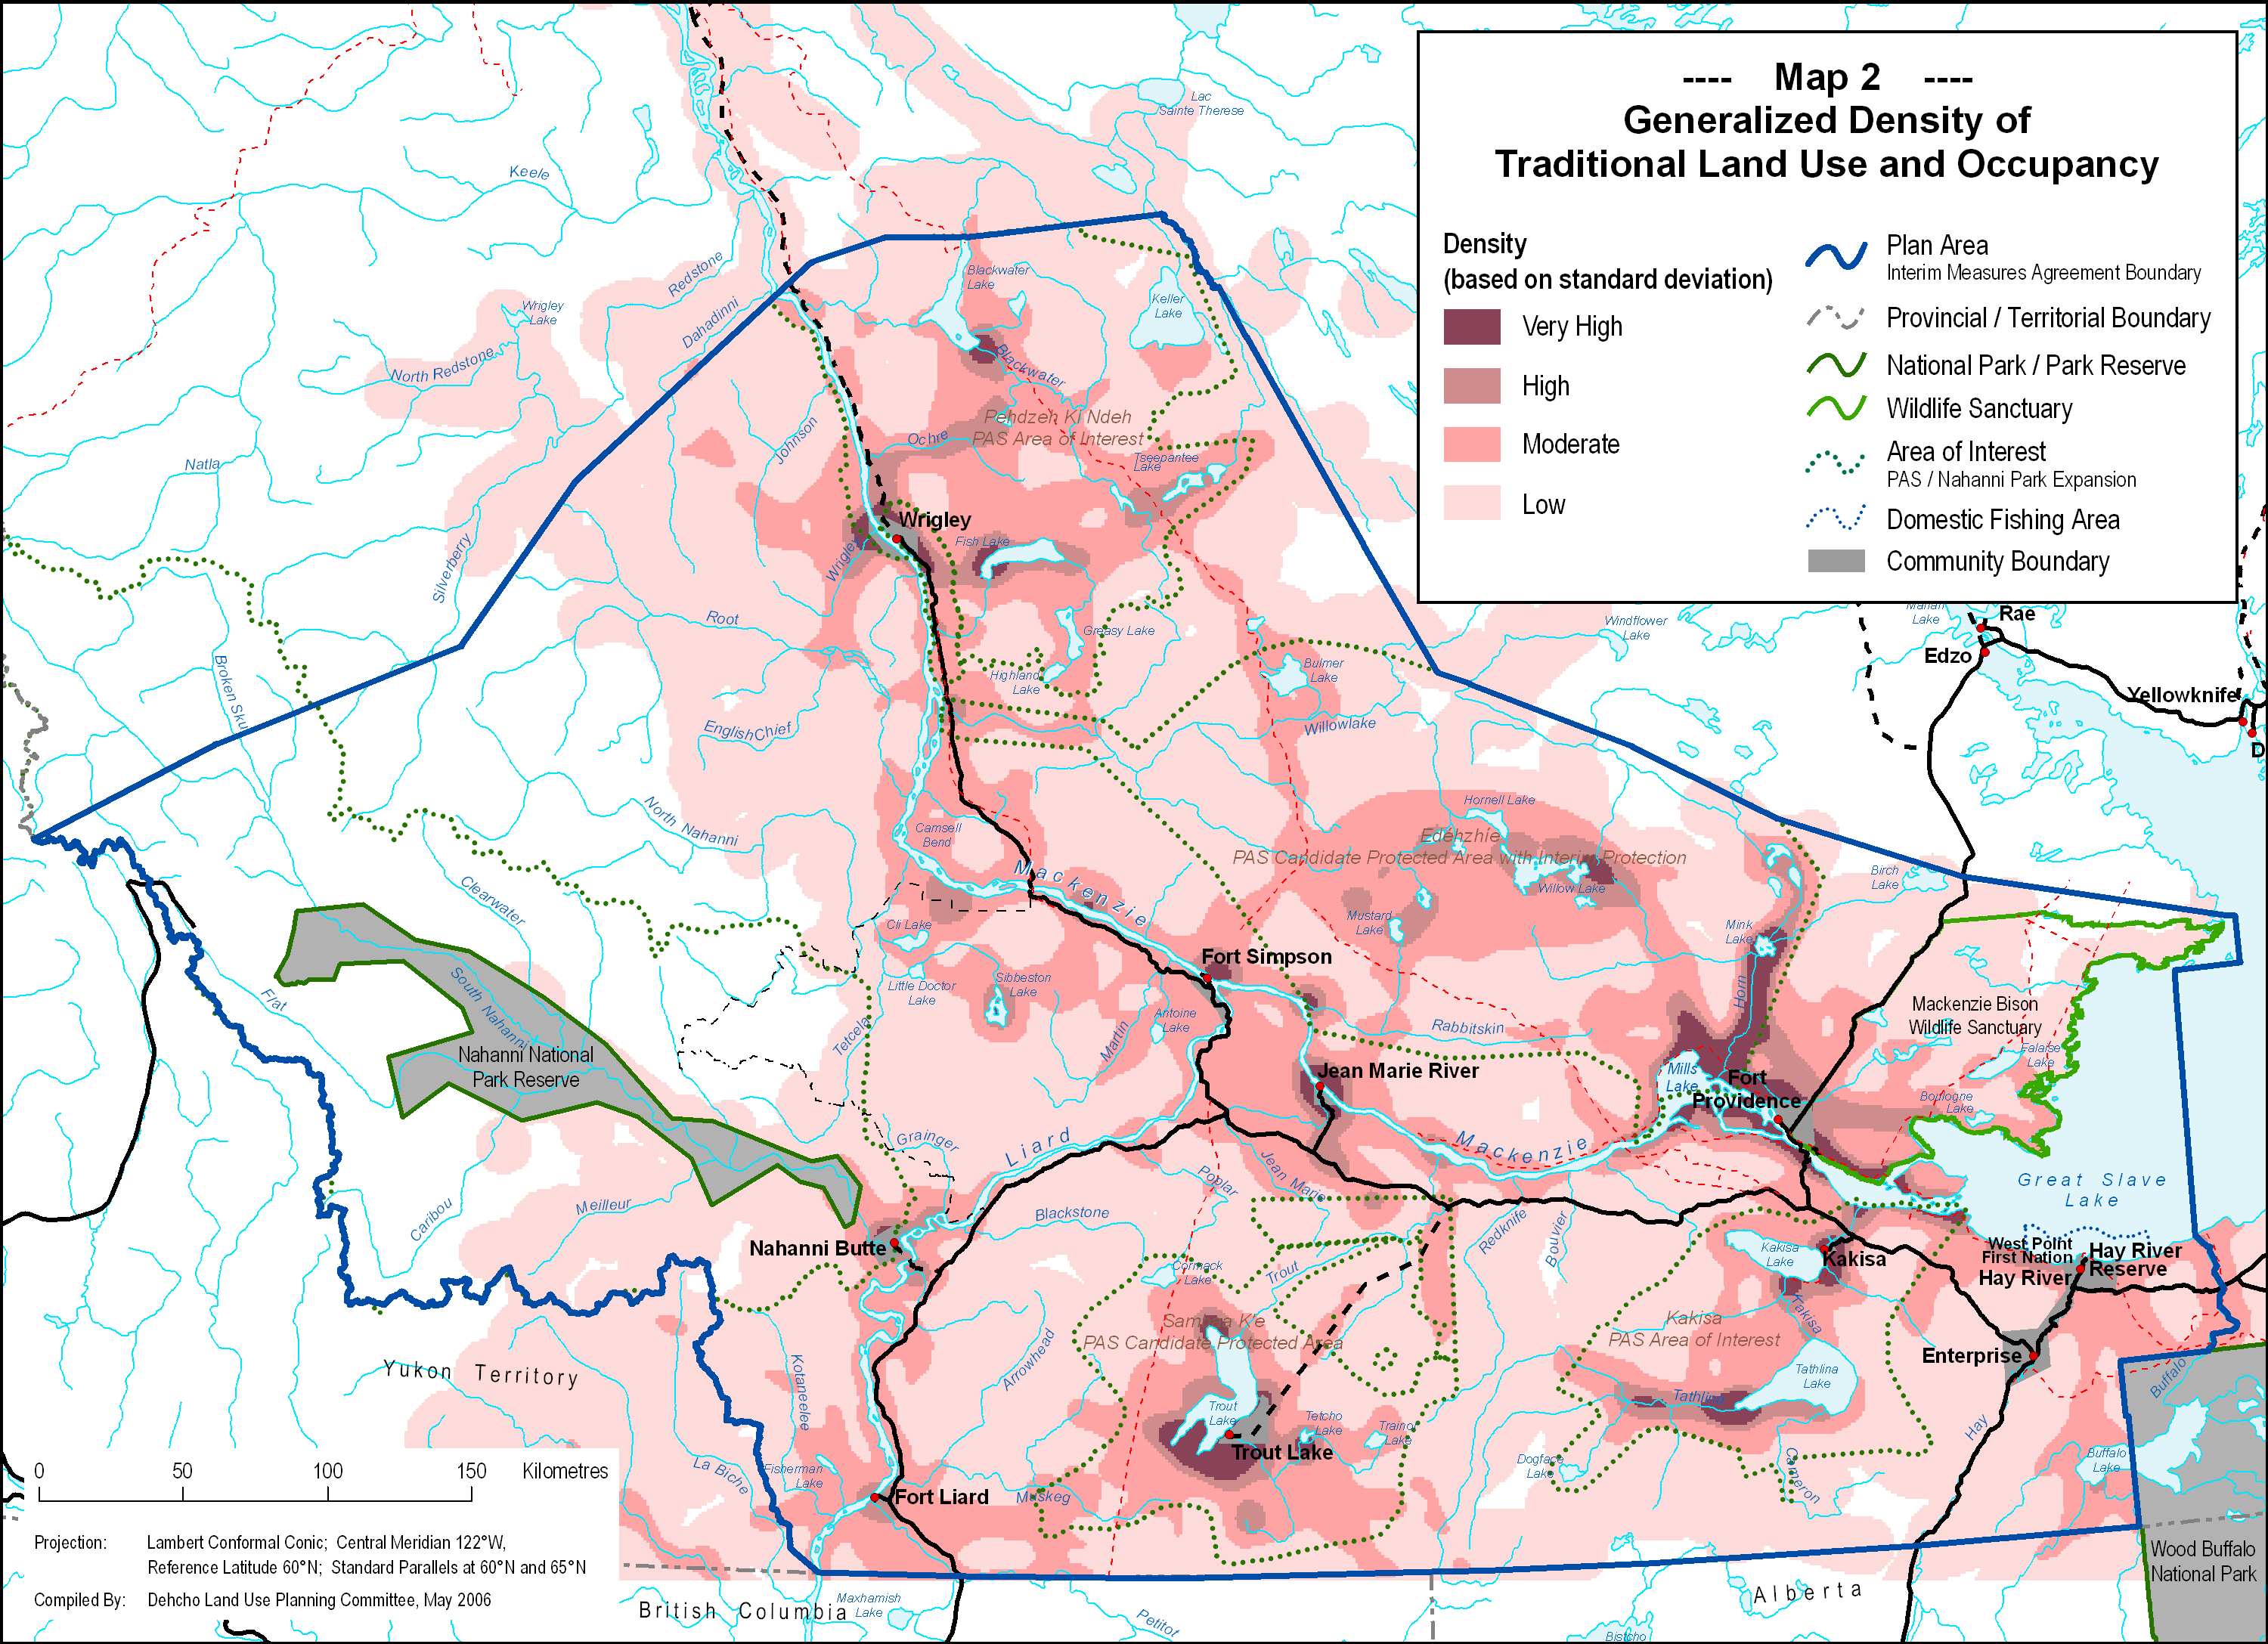
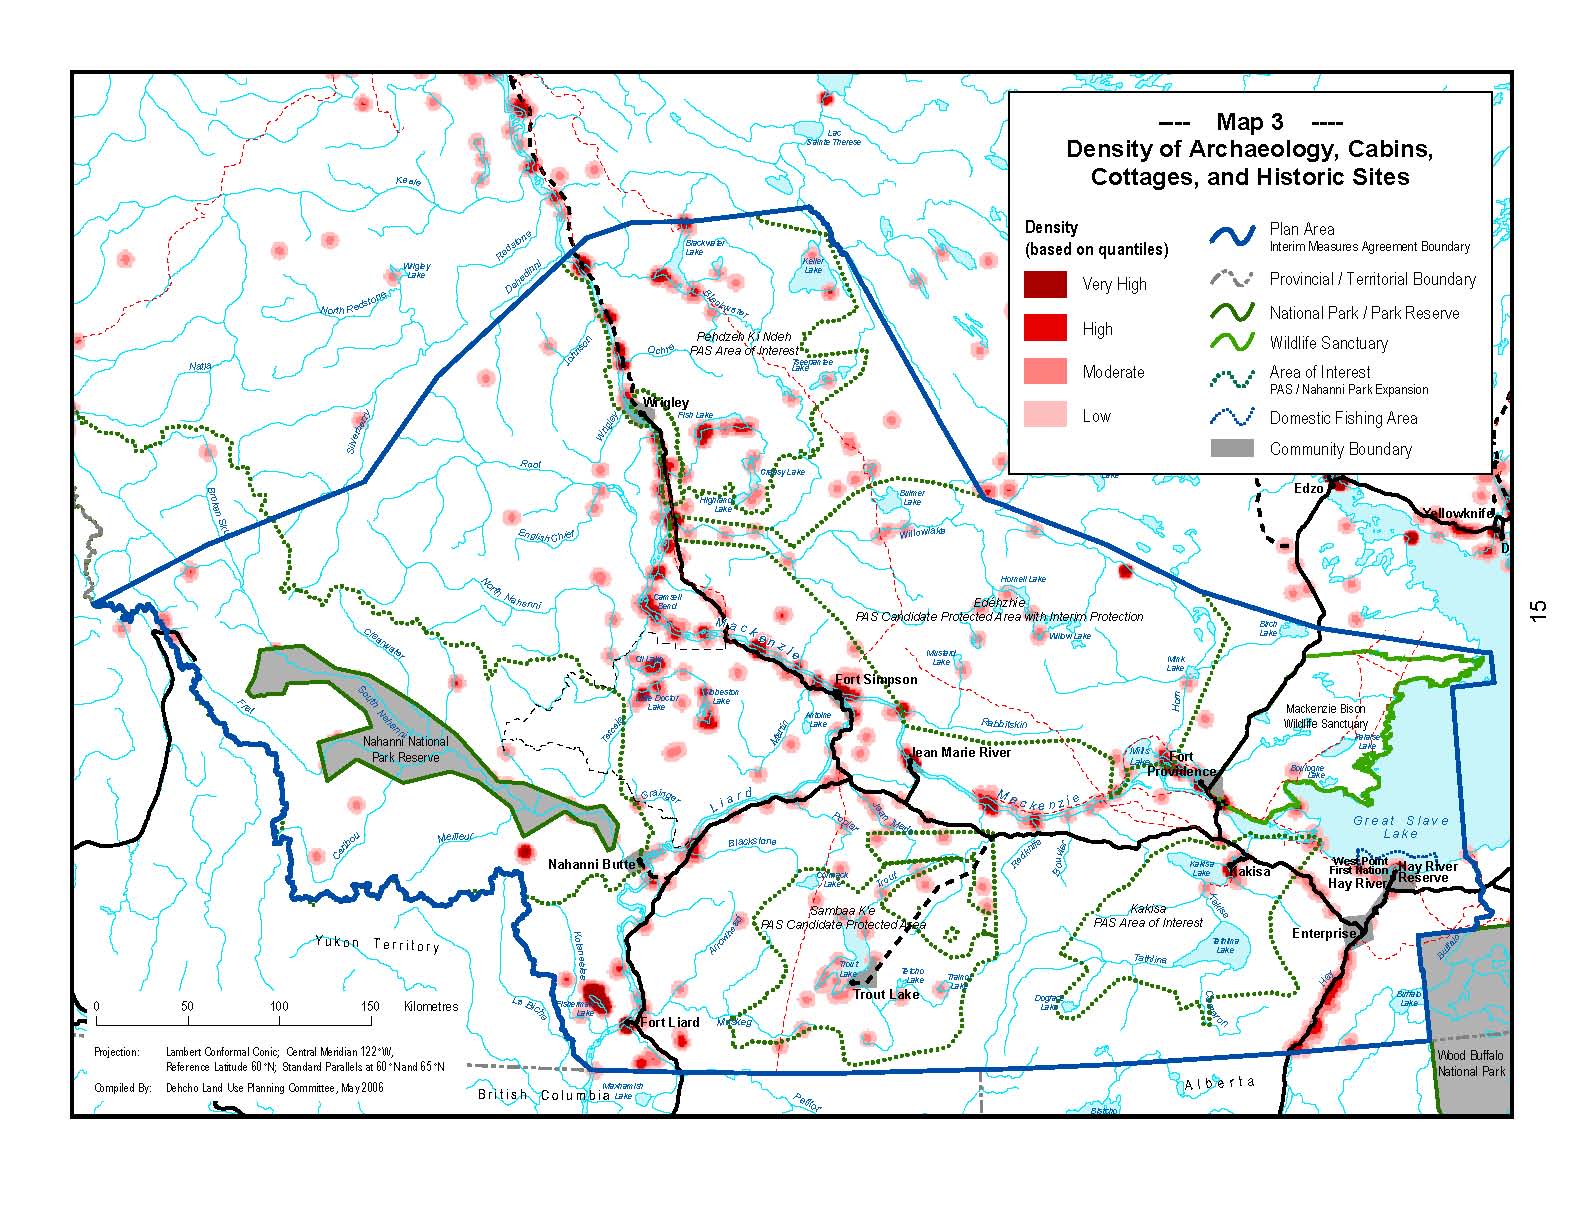
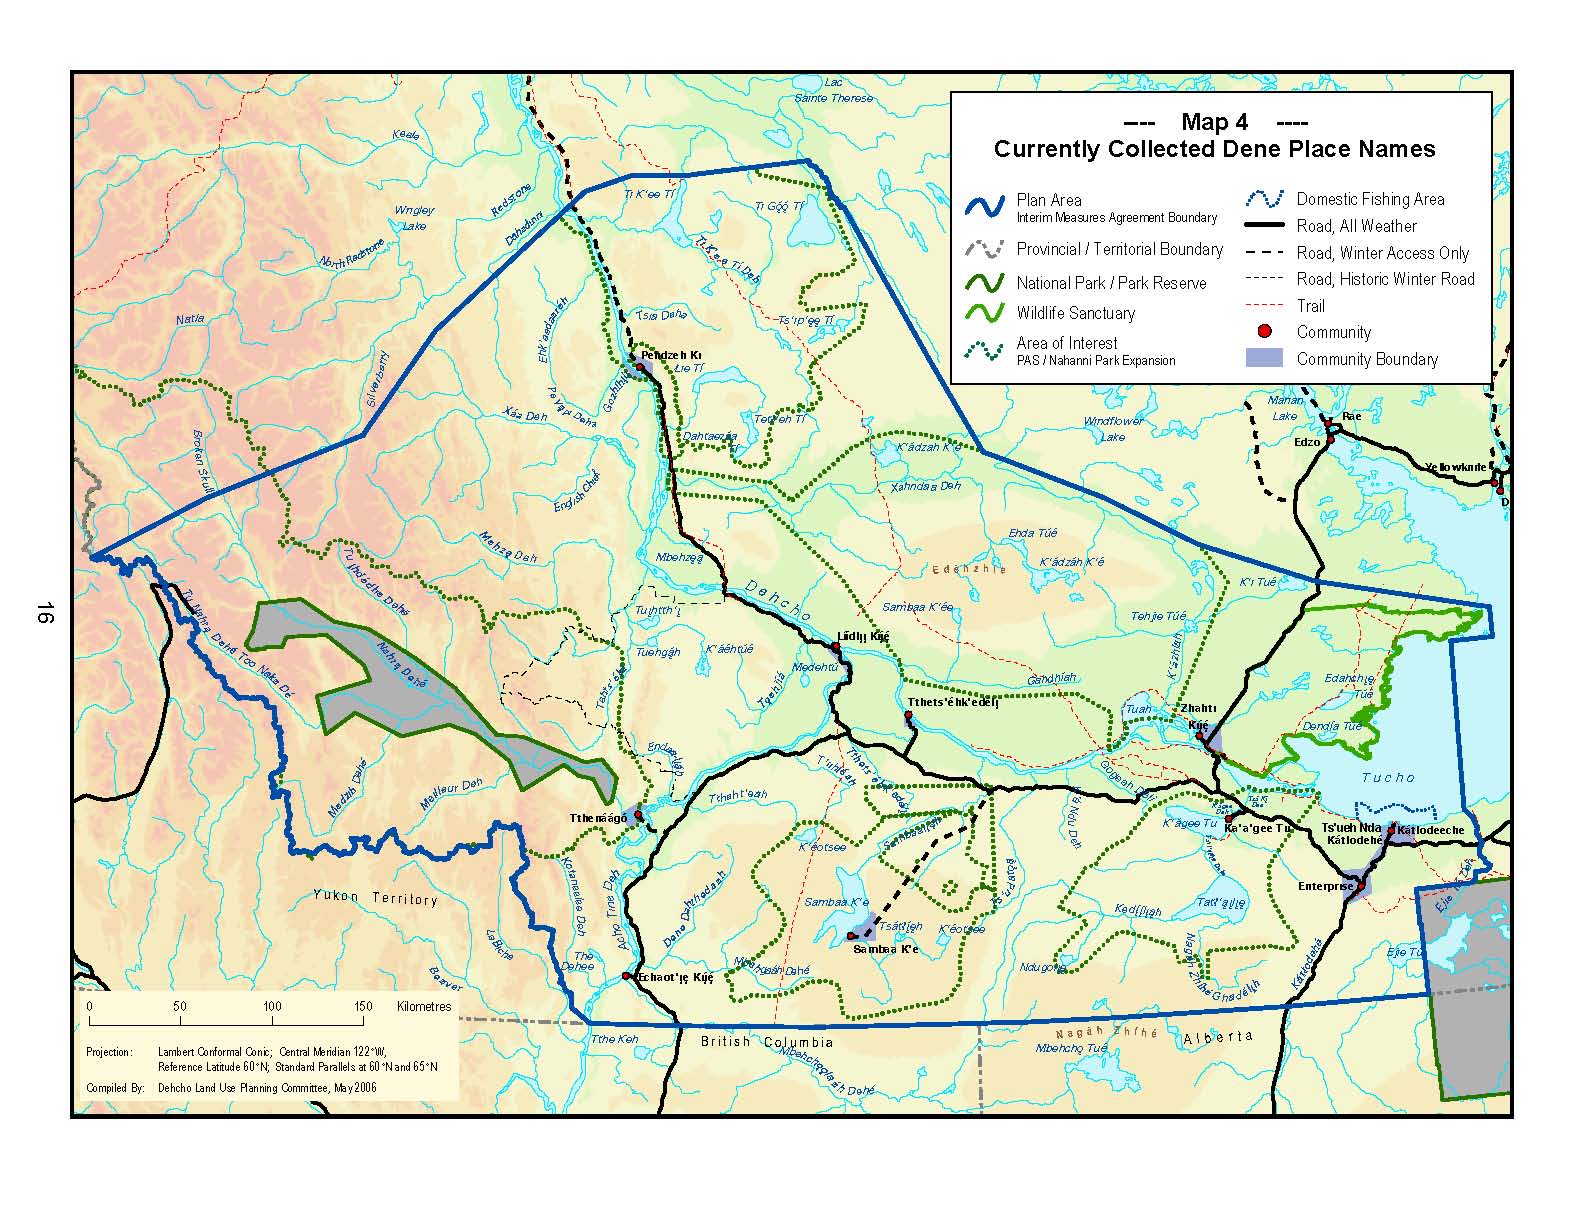
The collection of maps presented here are those shown in the Background Report as it was publicly released in June 2006.

Viewing and Download Instructions

Maps are available for viewing and download in either JPG or PDF format. [Click on the small thumbnail image to view a larger map in JPG format and then right-click the large image to save the JPG format map to your local drive]. 

[For high quality printing, the maps are also available in PDF format files. Please note, however, that some of the PDF format maps are quite large in file size and download time may be significant. To download a map in PDF format, right-click the PDF format link below the small thumbnail image. In order view the maps in PDF format you will need to have Adobe Acrobat Reader installed on your computer. Most maps are formatted to be printed in colour on 8.5” by 11” paper. While it is possible to enlarge, or shrink, the maps in order to print on different sizes of paper, this will change the scale of the map and may render some of the mapped features unreadable.]

Disclaimer

The Dehcho Land Use Planning Committee make no guarantees, representations or warranties respecting the maps, either expressed or implied, arising by law or otherwise, including but not limited to, effectiveness, completeness, accuracy or fitness for a particular purpose.

Maps from the Background Report – May 2006

Map 1. The Dehcho Territory thumbnail

Map 1. The Dehcho Territory

Map 2. Generalized Density of Traditional Land Use and Occupancy Thumbnail

Map 2. Generalized Density of Traditional Land Use and Occupancy

Map 3: Density of Archaeology, Cabins, Cottages and Historic Sites Thumbnail

Map 3: Density of Archaeology, Cabins, Cottages and Historic Sites

Map 4 – Currently Collected Dene Place Names Thumbnail

Map 4 – Currently Collected Dene Place Names

Map 05 – Ecoregions Thumbnail

Map 05 – Ecoregions

Map 6 – Land Cover Classification Thumbnail

Map 6 – Land Cover Classification

Map 7 – Mean Annual Temperature, Precipitation and Snowfall Thumbnail

Map 7 – Mean Annual Temperature, Precipitation and Snowfall

Map 9 – Fire History Thumbnail

Map 9 – Fire History

Map 10 – Spruce Budworm Distribution by White Spruce Defoliation (2002) Thumbnail

Map 10 – Spruce Budworm Distribution by White Spruce Defoliation (2002)

Map 11. Watersheds Thumbnail

Map 11. Watersheds

Map 12. Wildlife Habitat Values and Significant Environmental Features Thumbnail

Map 12. Wildlife Habitat Values and Significant Environmental Features

Map 13 – Woodland Caribou (Rangifer tarandus caribou) Distribution Home Range Analysis Thumbnail

Map 13 – Woodland Caribou (Rangifer tarandus caribou) Distribution Home Range Analysis

Map 14. Forestry Potential Thumbnail

Map 14. Forestry Potential

Map 15. Agricultural Potential Thumbnail

Map 15. Agricultural Potential

Map 16. Tourism Potential Thumbnail

Map 16. Tourism Potential

Map 17. Estimated Remaining Recoverable Oil and Gas Thumbnail

Map 17. Estimated Remaining Recoverable Oil and Gas

Map 18. Mineral Development Potential Thumbnail

Map 18. Mineral Development Potential

Map 55 – Existing Land Uses Thumbnail

Map 19 – Critical Wildlife, Traditional Land Use and Conservation Intersect

Map 55 – Existing Land Uses Thumbnail

Map 55 – Existing Land Uses

Maps 56 - Agriculture Potential, Land Withdrawals and Land Use Zoning Thumbnail

Maps 56 - Agriculture Potential, Land Withdrawals and Land Use Zoning

Maps 57 – Forestry Potential, Land Withdrawals and Land Use Zoning Thumbnail

Maps 57 – Forestry Potential, Land Withdrawals and Land Use Zoning

Maps 58 – Mineral Potential, Land Withdrawals and Land Use Zoning Thumbnail

Maps 58 – Mineral Potential, Land Withdrawals and Land Use Zoning

Maps 59 – Oil and Gas Potential, Land Withdrawals and Land Use Zoning Thumbnail

Maps 59 – Oil and Gas Potential, Land Withdrawals and Land Use Zoning

Maps 60 – Tourism Potential, Land Withdrawals and Land Use Zoning Thumbnail

Maps 60 – Tourism Potential, Land Withdrawals and Land Use Zoning

Map 62 - Ecological Representation of Ecoregions and Enduring Features Thumbnail

Map 62 - Ecological Representation of Ecoregions and Enduring Features

Map 64. Current Level of Disturbance Thumbnail

Map 64. Current Level of Disturbance

Map 65 – Corridor Density Analysis Thumbnail

Map 65 – Corridor Density Analysis

Map 66 – Road Density Analysis Thumbnail

Map 66 – Road Density Analysis

Map 67 – Core Area Analysis Thumbnail

Map 67 – Core Area Analysis

Map 68 – Stream Crossing Density Analysis Thumbnail

Map 68 – Stream Crossing Density Analysis